CoreTrace
Overview
Tracing system calls is a dynamic analysis reverse engineering technique that can offer a quick way to understand a program’s behavior. Corellium makes it easy to trace system calls using either our proprietary CoreTrace tool. Here's how to get started with it!
Setting up CoreTrace
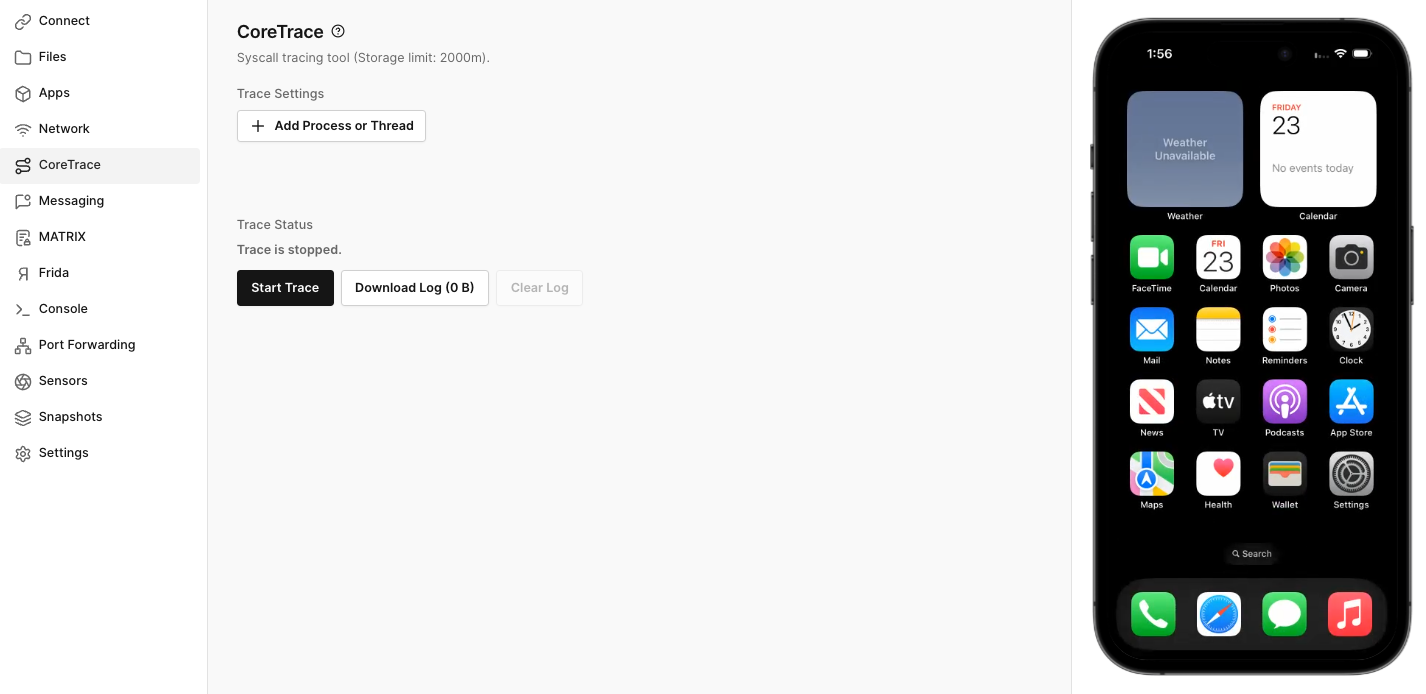
To access CoreTrace, open the CoreTrace tab on the device screen. The CoreTrace UI allows you to start and stop a trace, download the log generated by tracing, and clear the log.
Threads and Processes
By default, CoreTrace traces all threads in the system. This rapidly produces a huge amount of data. Often you’ll be interested in a particular target. To apply a filter to the results, click "Add a process or thread" to display the Processes dialog:
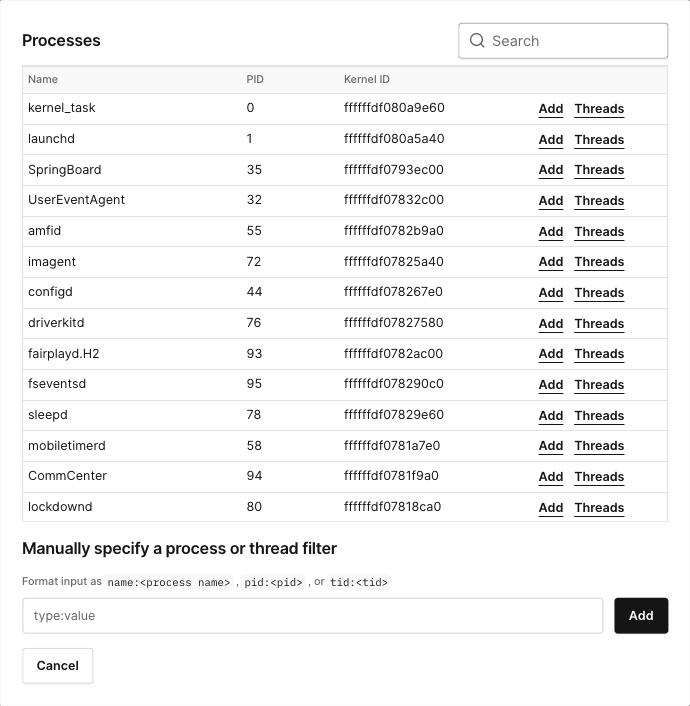
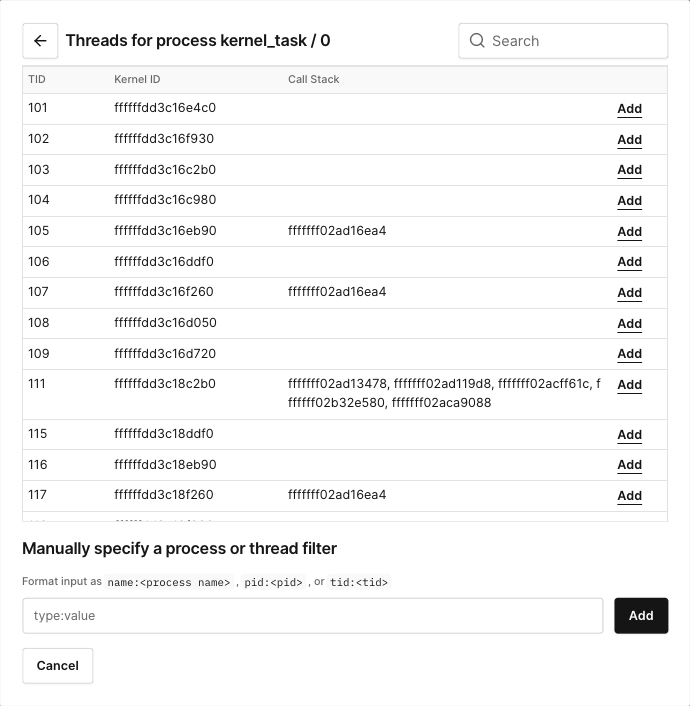
The Processes dialog displays all processes and threads in the system. To examine the threads inside a process, click the "THREADS" button in the process's row.
To add a filter, click the "ADD" button in the process's or thread’s row. Alternatively, specify a filter manually. Trace will log traces as long as they match at least one filter.
There are often many processes running. To more easily find the processes and threads you’re interested in, click the magnifying glass in the top-right corner of the dialog and type a phrase. Only rows that contain the phrase will be displayed.
Then, you are ready to click Start Trace.
Understanding the Results
After you have captured the trace (or during the capture) you can download the log file. Each line of the log will look like this:
<1> [00248.864651618] ffffff806401e040-0/337:[email protected]/ @00000070efc0b834 read ( fd: 5, buf: 0x6e5f6ec980, count: 4 ) ... @[ 0000006e5f6f9778 0000006e5f6f9840 0000006e5f6f948c 0000006e5f6f7f90 0000006e5f6f7b54 0000006e5f6f7434 00000070efc2088c 00000070efbc0e0c ]
or like this:
<1> [00248.864656648] ffffff806401e040-0/337:[email protected]/ @00000070efc0b834 ... read ( result: 4, buf: 0x6e5f6ec980 -> [s"001e"] )
The fixed line header contains the following information:
<cpu> [time.nsec] threadid-sigid/pid:comm.tid/ @pc
Where:
cpuis the processor core the log comes from,time.nsecis the time the entry was captured by the hypervisor,threadidis the internal kernel thread ID (usually the address of a task or thread structure, depending on Linux vs iOS)sigidis the signal state (if a signal happens, a thread could execute in a different signal state before it's done with the signal, then return to the original signal state),pidis the process ID (PID of the process on Linux),commis the short process name, which may be the original command but may also be set by process itself (Android likes doing that),tidis the thread ID (PID of the thread on Linux),pcis the PC where the syscall happened in EL0 (userland).
After the header, lines that end with ... are syscall invocations, and lines that start with ... are syscall returns. On syscall invocation lines, if the environment permits it, there will be an additional trailer of the form:
@[ lr ret1 ret2 ret3 ... ]
This trailer contains the EL0 return stack of the function that invoked the syscall.
Android Binder Tracing with CoreTrace
Android Binder Tracing gives you, the user, an idea of what is being sent across binder interfaces when running CoreTrace. This will give the user the needed information so the user can easily dig deeper into the results.
Here are some of the messages we are able to parse with an explanation of each output.
- Each Binder message includes an interface token/header identifying the interface it's targeting. Using the interface name and transaction code, the corresponding method can be located in the source code. If parsing fails after the interface header, the remaining bytes are displayed as a hex buffer.
Example:
<1> [00062.180104000] ffffff800f985640-0/329:.352/ @0000007678dc19a4 ... ioctl ( result: 0, arg: 0x73da8da710 -> { write_size: 76, write_consumed: 76, write_buffer: 0x74b56de2b0 -> [ { cmd: 0x40486311 (BC_TRANSACTION_SG), trn: { target: 2, cookie: 0, code: 3, flags: 17, sender_pid: 0, sender_euid: 0, data_size: 76, offsets_size: 0, buffer: 0x74656db390 ->, binder msg: "interface_descriptor" => "<cstring: contents={ "[email protected]::IComposerCallback" }>", "data" => "<buffer: length=16 contents={ [ 0x00 0x00 0x00 0x00 0x00 0x00 0x00 0x00 0xf8 0x16 0xbc 0x26 0x0e 0x00 0x00 0x00 ] }>", offsets: 0, buffers_size: 0 } } ], read_size: 256, read_consumed: 8, read_buffer: 0x74b56dde30 -> [ { rsp: 0x720c (BR_NOOP) }, { rsp: 0x7206 (BR_TRANSACTION_COMPLETE) } ] } )
- For most aidl-defined and meta-interfaces, users will now be able to see the method that is being called by the interface. The method name isn't technically parsed from the message, rather it is looked up based on the interface name and the code. If nothing beyond the method can be parsed, the remaining bytes will be dumped as a hex buffer.
Example:
<1> [00061.402983300] ffffff802324c500-0/580:ActivityManager.616/ @0000007a86ac49a4 ... ioctl ( result: 0, arg: 0x76b5ee7b00 -> { write_size: 68, write_consumed: 68, write_buffer: 0x7805b40450 -> [ { cmd: 0x40406300 (BC_TRANSACTION), trn: { target: 140, cookie: 0, code: 1, flags: 17, sender_pid: 0, sender_euid: 0, data_size: 3524, offsets_size: 0, buffer: 0x7855b36220 ->, binder msg: "strict_mode_policy" => "<int32: contents={ 0x8600007f }>", "work_source_uid" => "<int32: contents={ 0x000003e8 }>", "version_header" => "<int32: contents={ 0x53595354 (SYST) }>", "interface_descriptor" => "<string: length=30 contents={ "android.app.IApplicationThread" }>", "method" => "void scheduleReceiver(in Intent intent, in ActivityInfo info, in CompatibilityInfo compatInfo, int resultCode, in String data, in Bundle extras, boolean ordered, boolean assumeDelivered, int sendingUser, int processState, int sentFromUid, in String sentFromPackage)", "data" => "<buffer: length=3444 contents={ [ 0x01 0x00 0x00 0x00 0x2b 0x00 0x00 0x00 0x61 0x6e 0x64 0x72 0x6f 0x69 0x64 0x2e 0x69 0x6e 0x74 0x65 0x6e 0x74 0x2e 0x61 0x63 0x74 0x69 0x6f 0x6e 0x2e 0x42 0x41 0x54 0x54 0x45 0x52 0x59 0x5f 0x4c 0x45 0x56 0x45 0x4c 0x5f 0x43 0x48 0x41 0x4e 0x47 0x45 0x44 0x00 0x00 0x00 0x00 0x00 0xff 0xff 0xff 0xff 0xff 0xff 0xff 0xff 0x10 0x00 0x00 0x01 0x00 0x00 0x00 0x00 0xff 0xff 0xff 0xff 0x14 0x00 0x00 0x00 0x63 0x00 0x6f 0x00 0x6d 0x00 0x2e 0x00 0x61 0x00 0x6e 0x00 0x64 0x00 0x72 0x00 0x6f 0x00 0x69 0x00 0x64 0x00 0x2e 0x00 0x73 0x00 0x65 0x00 0x74 0x00 0x74 0x00 0x69 0x00 0x6e 0x00 0x67 0x00 0x73 0x00 0x00 0x00 0x00 0x00 0x49 0x00 0x00 0x00 0x63 0x00 0x6f 0x00 0x6d 0x00 0x2e 0x00 0x61 0x00 0x6e 0x00 0x64 0x00 0x72 0x00 0x6f 0x00 0x69 0x00 0x64 0x00 0x2e 0x00 0x73 0x00 0x65 0x00 0x74 0x00 0x74 0x00 0x69 0x00 0x6e 0x00 0x67 0x00 0x73 0x00 0x2e 0x00 0x66 0x00 0x75 0x00 0x65 0x00 0x6c 0x00 0x67 0x00 0x61 0x00 0x75 0x00 0x67 0x00 0x65 0x00 0x2e 0x00 0x62 0x00 0x61 0x00 0x74 0x00 0x74 0x00 0x65 0x00 0x72 0x00 0x79 0x00 0x75 0x00 0x73 0x00 0x61 0x00 0x67 0x00 0x65 0x00 0x2e 0x00 0x42 0x00 0x61 0x00 0x74 0x00 0x74 0x00 0x65 0x00 0x72 0x00 0x79 0x00 0x55 0x00 0x73 0x00 0x61 0x00 0x67 0x00 0x65 0x00 0x42 0x00 0x72 0x00 0x6f 0x00 0x61 0x00 0x64 0x00 0x63 0x00 0x61 0x00 0x73 0x00 ... ] }>", offsets: 0 } } ], read_size: 256, read_consumed: 8, read_buffer: 0x7805b3fb50 -> [ { rsp: 0x720c (BR_NOOP) }, { rsp: 0x7206 (BR_TRANSACTION_COMPLETE) } ] } )
- For methods which have arguments only consisting of the following types, users will see the full method parsed similar to XPC in iOS. The paresable types are:
boolean,byte,char,int,long,float,double,string, andstrong binder. If the arguments include non-parsable types, the remaining message will be dumped as hex.
<0> [00061.511006150] ffffff80421c33c0-0/941:binder:941_1.951/ @0000007a86ac49a4 ... ioctl ( result: 0, arg: 0x77bbd43558 -> { write_size: 0, write_consumed: 0, write_buffer: 0x7805b34090, read_size: 256, read_consumed: 72, read_buffer: 0x7805b315d0 -> [ { rsp: 0x720c (BR_NOOP) }, { rsp: 0x80407202 (BR_TRANSACTION), trn: { target: 0x77f5b96d30, cookie: 0x7835b6b6b0, code: 7, flags: 17, sender_pid: 0, sender_euid: 1000, data_size: 100, offsets_size: 0, buffer: 0x77bbd4b000 ->, binder msg: "strict_mode_policy" => "<int32: contents={ 0x80000000 }>", "work_source_uid" => "<int32: contents={ 0x00002760 }>", "version_header" => "<int32: contents={ 0x53595354 (SYST) }>", "interface_descriptor" => "<string: length=34 contents={ "android.net.INetworkPolicyListener" }>", "method" => "void onBlockedReasonChanged(int uid, int oldBlockedReason, int newBlockedReason)", "uid" => "<int: contents={ 10066 }>", "oldBlockedReason" => "<int: contents={ 0 }>", "newBlockedReason" => "<int: contents={ 64 }>" , offsets: 0x77bbd4b068 } } ] } )
Parsers for Parcelable type are not yet supported, but may be implemented in the future based on demand. If you would like to see support for particular Parcelables, please let us know by contacting support
- For methods that have no arguments, the user will be able to see the method name, but there will be no hexdump, because the message has been fully parsed.
Example:
<1> [00061.413028500] ffffff804521d640-0/1009:ndroid.settings.1009/ @0000007a86ac49a4 ... ioctl ( result: 0, arg: 0x7fff4304d0 -> { write_size: 68, write_consumed: 68, write_buffer: 0x7805b31150 -> [ { cmd: 0x40406300 (BC_TRANSACTION), trn: { target: 39, cookie: 0, code: 3, flags: 17, sender_pid: 0, sender_euid: 0, data_size: 88, offsets_size: 0, buffer: 0x7865b54560 ->, binder msg: "strict_mode_policy" => "<int32: contents={ 0x8600007c }>", "work_source_uid" => "<int32: contents={ 0xffffffff }>", "version_header" => "<int32: contents={ 0x53595354 (SYST) }>", "interface_descriptor" => "<string: length=35 contents={ "android.gui.IDisplayEventConnection" }>", "method" => "void requestNextVsync()", offsets: 0 } } ], read_size: 256, read_consumed: 8, read_buffer: 0x7805b33310 -> [ { rsp: 0x720c (BR_NOOP) }, { rsp: 0x7206 (BR_TRANSACTION_COMPLETE) } ] } )
- For Binder Transaction Replies, the exception is now parsed as a uint32_t, and the remaining reply message is dumped as hex.
Example:
{ cmd: 0x40406301 (BC_REPLY), trn: { target: 0xffffffff, cookie: 0, code: 0, flags: 0, sender_pid: 0, sender_euid: 0, data_size: 12, offsets_size: 0, buffer: 0x7865bb9a80 ->, binder msg: "exception" => "<int32: contents={ 0x00000000 }>", "data" => "<buffer: length=8 contents={ [ 0xd7 0xbc 0x00 0x00 0x00 0x00 0x00 0x00 ] }>", offsets: 0 } } ], read_size: 256, read_consumed: 0, read_buffer: 0x7805baba30 } ) ... @[ 0000007a86a6e3d4 0000007aa896b6f0 0000007aa896a014 0000007aa8980ea0 0000007a8b8f1b18 0000007a8bc35b0c 0000007a86a73358 0000007a86a65fc8 ]