HyperTrace
HyperTrace provides functionality for mapping the exact execution paths inside the kernel, which can be useful for diagnosing kernel issues or integrated into coverage-guided fuzzers to assist with finding new inputs. This feature supports collection of full program flow information or block-level code coverage.
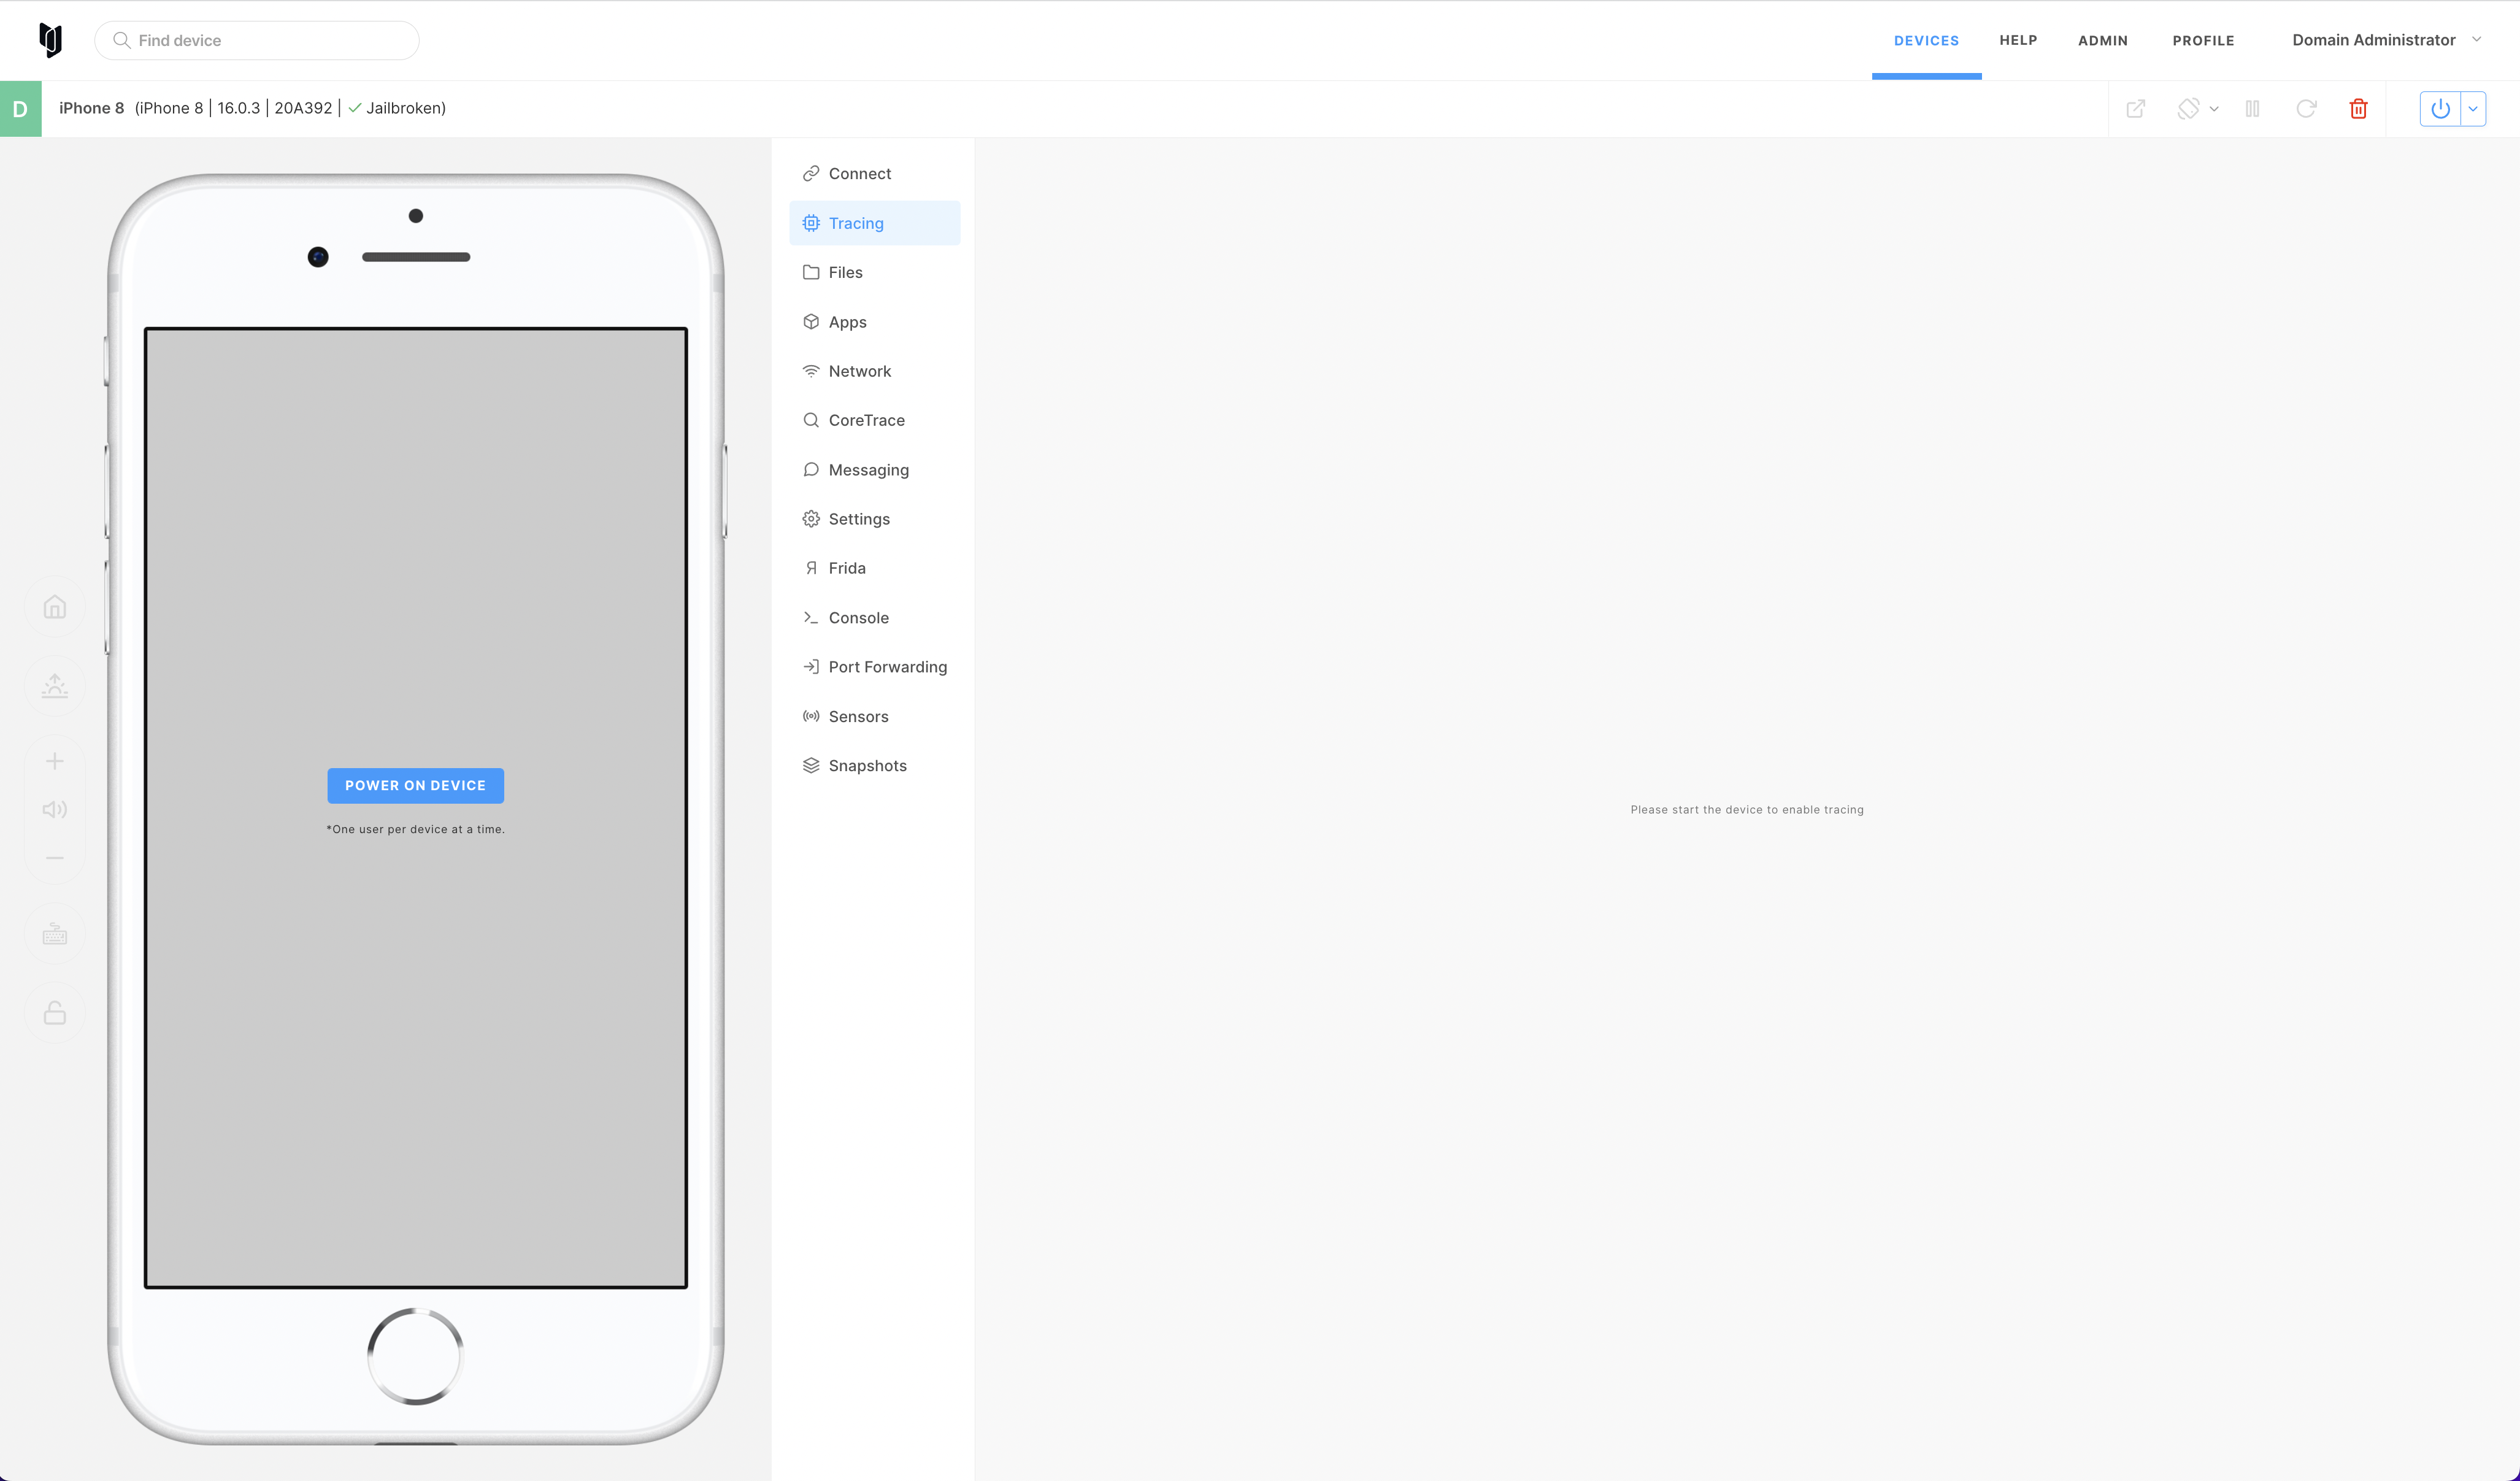
When you navigate to iOS device you will see a new HyperTrace tab, and to start using this feature you need to power on the device first.
Tracing options
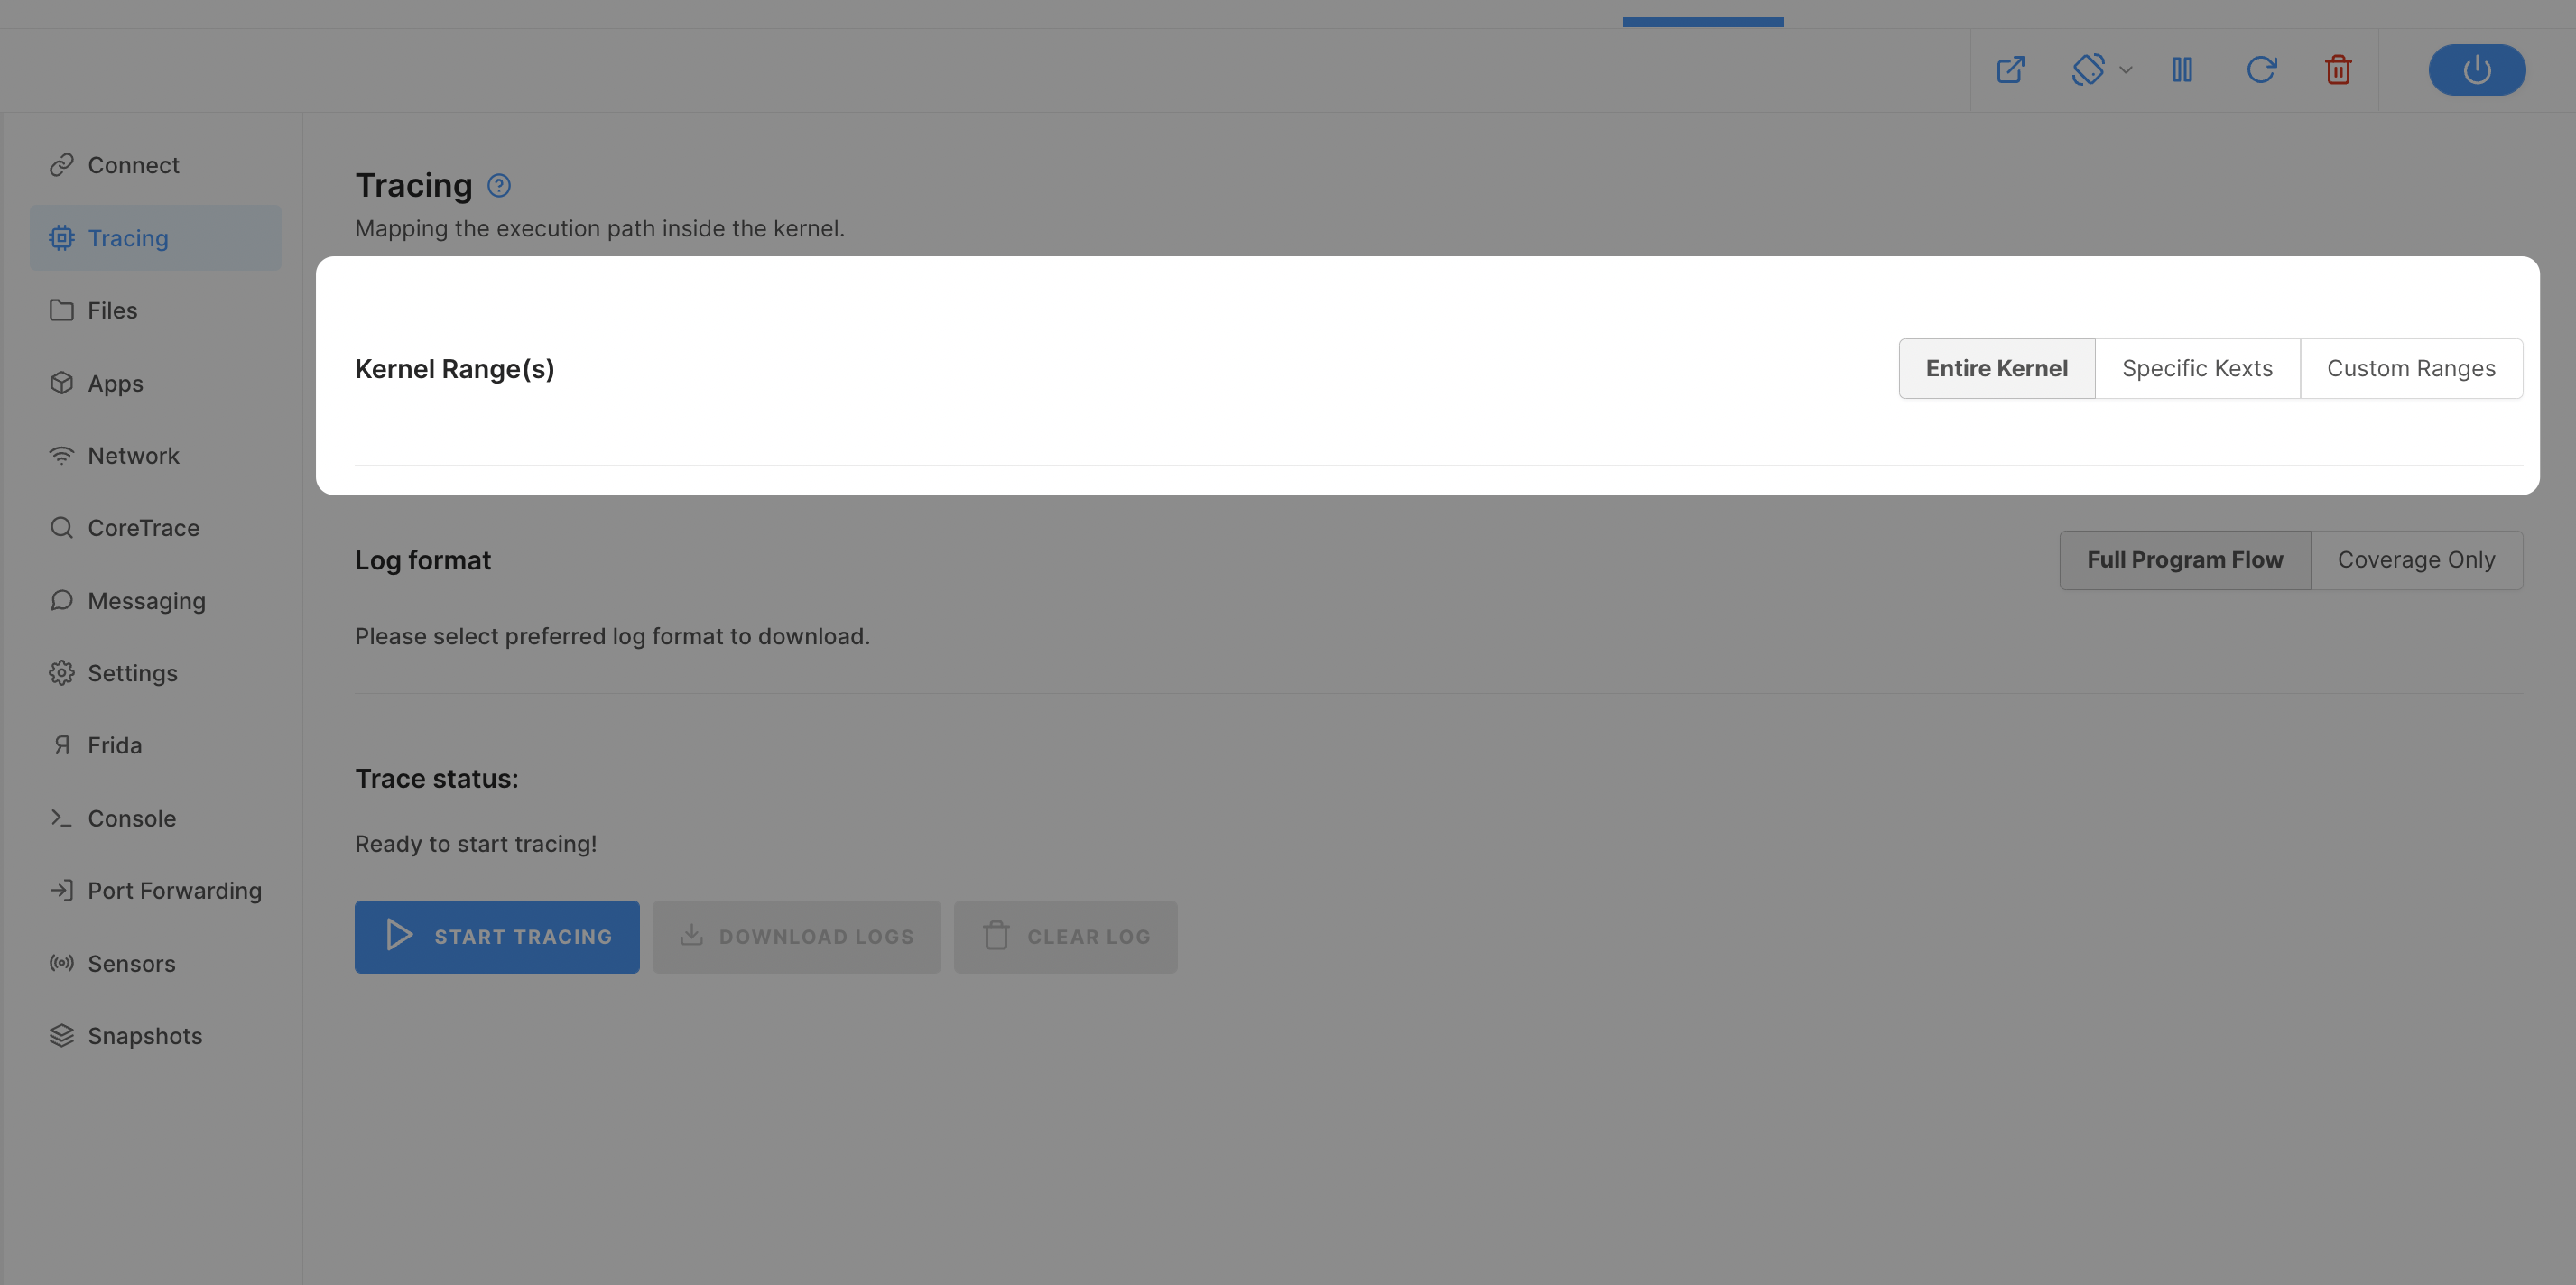
Once you power on your device we start preparing device for tracing, once that is done tracing tab will look like this:
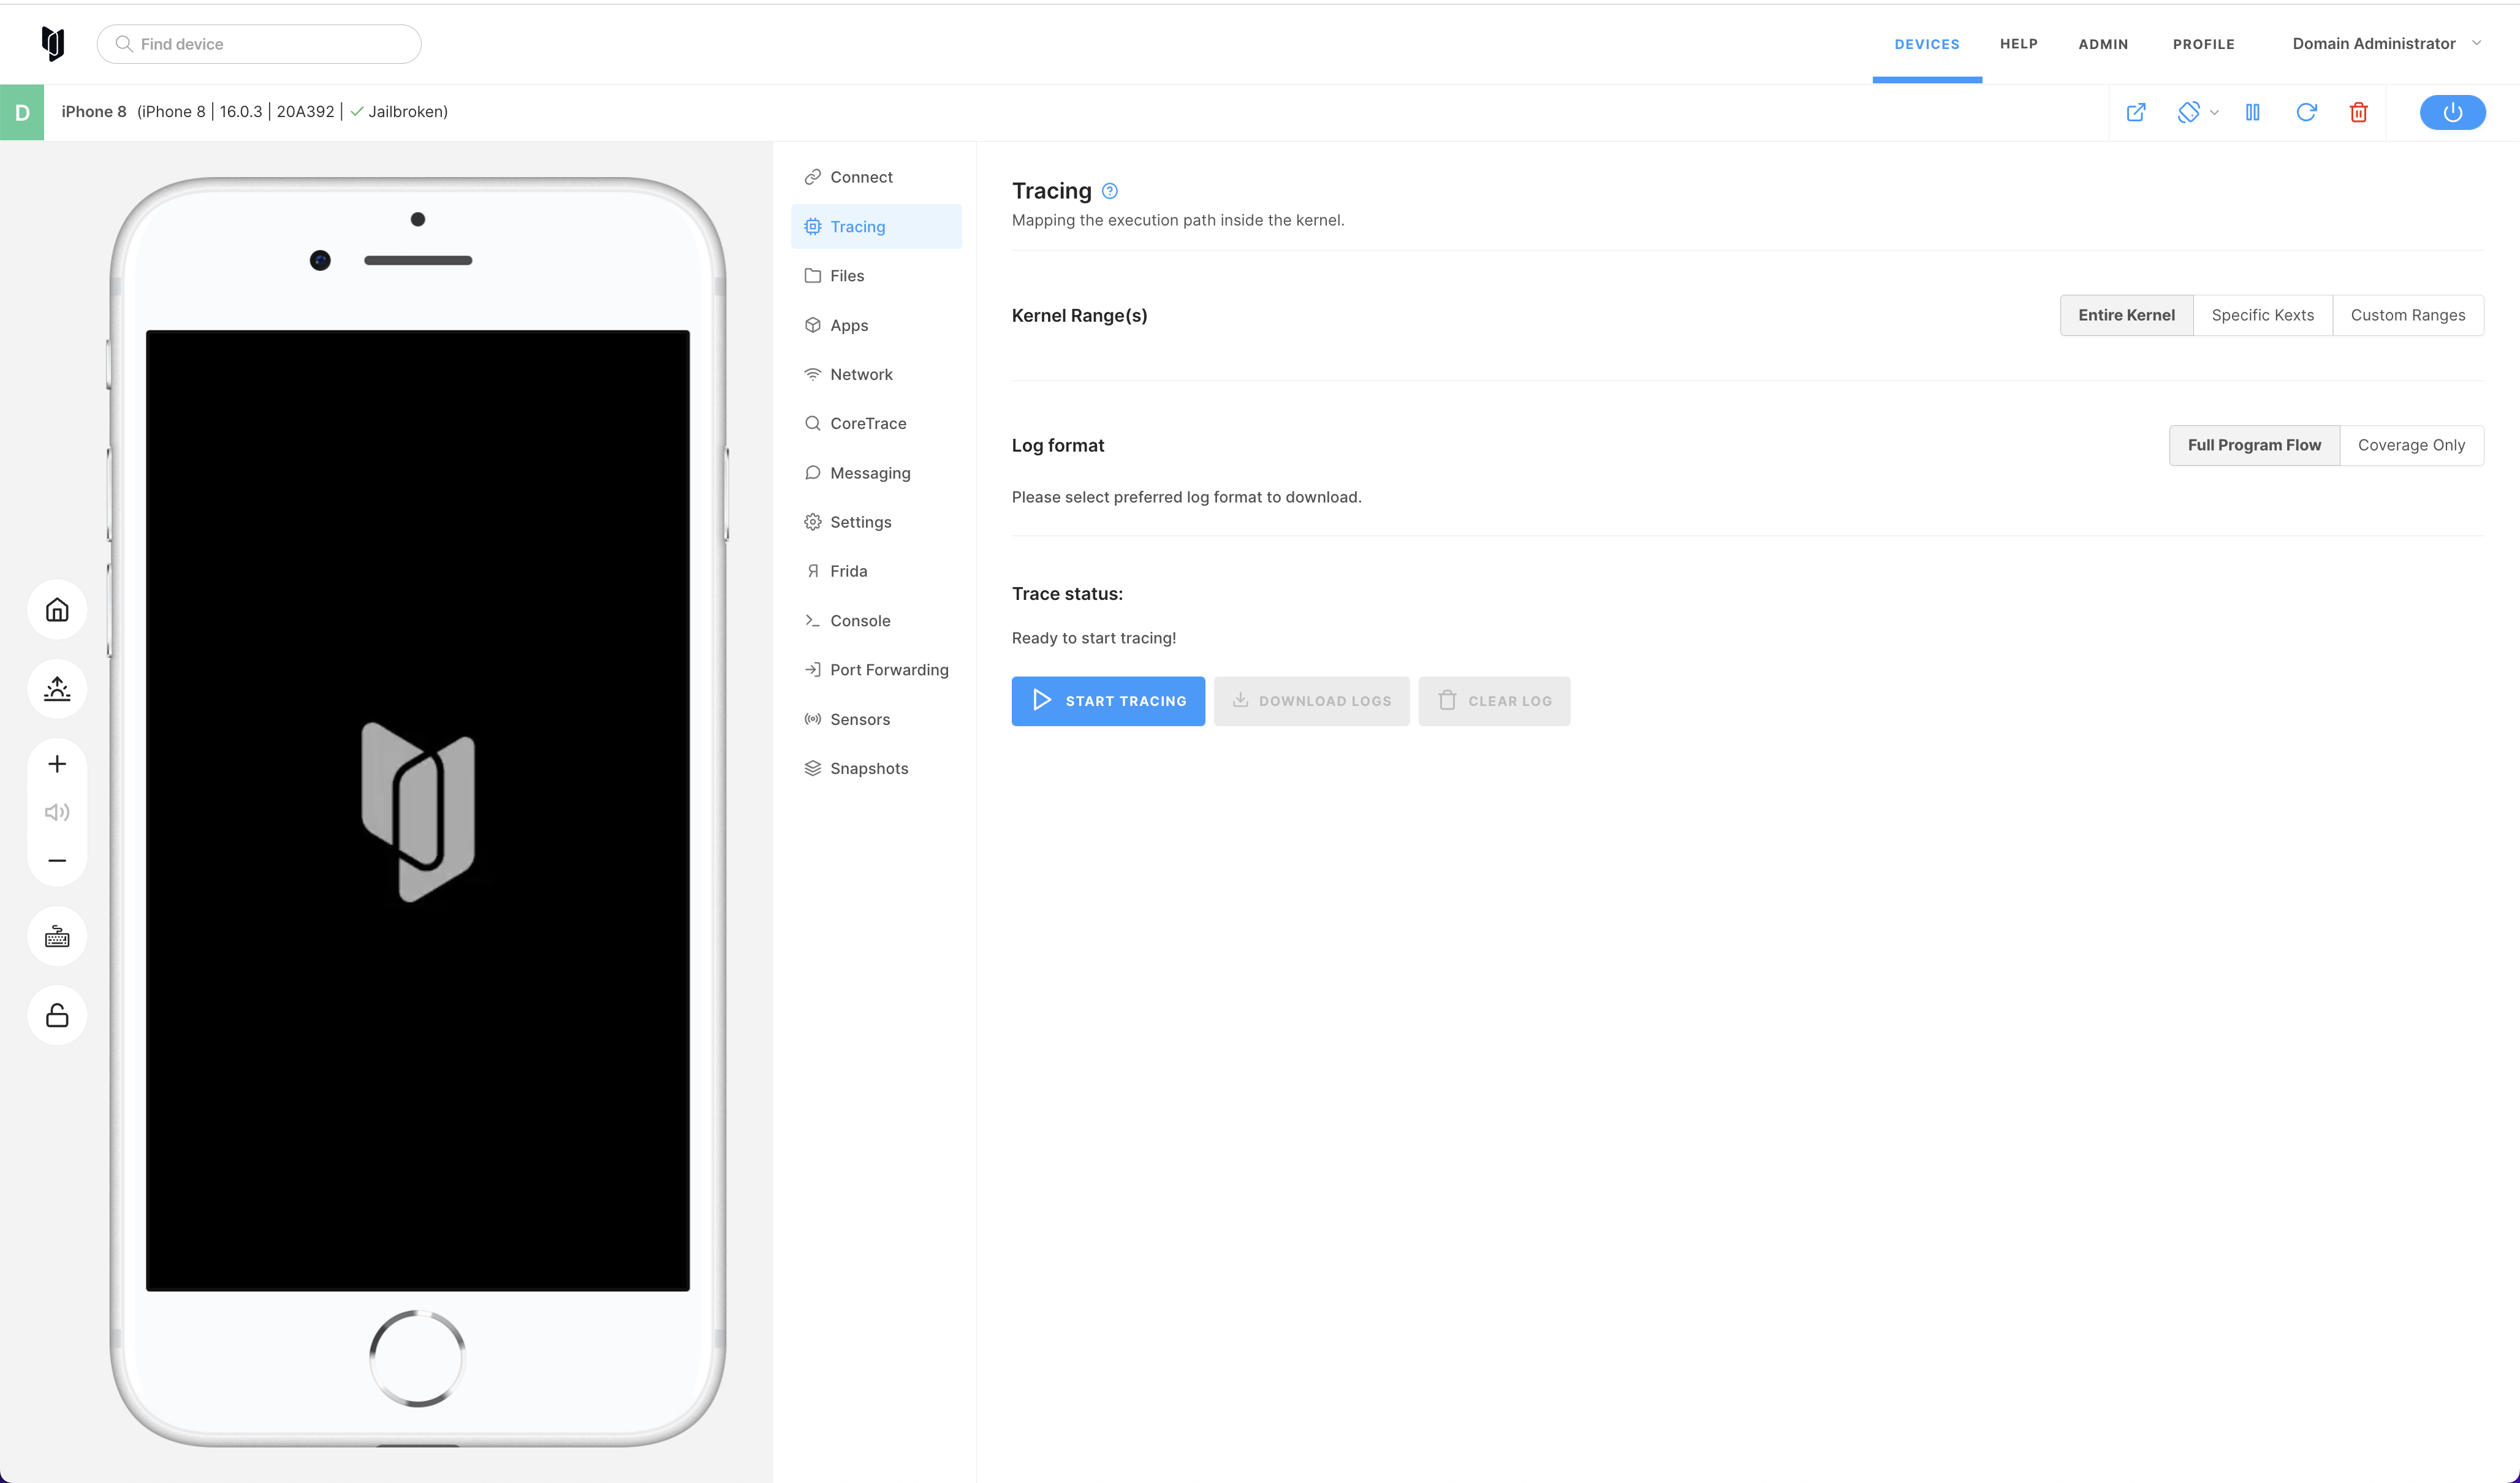
It means that you can choose tracing option from kernel ranges options.
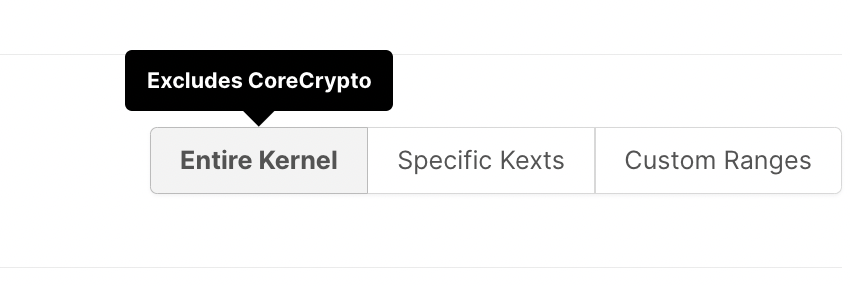
Entire kernel
For this option, we exclude CoreCrypto ranges from tracing logs. This is required due to integrity checks CoreCrypto performs on itself, preventing the dynamic patching required to collect tracing information.
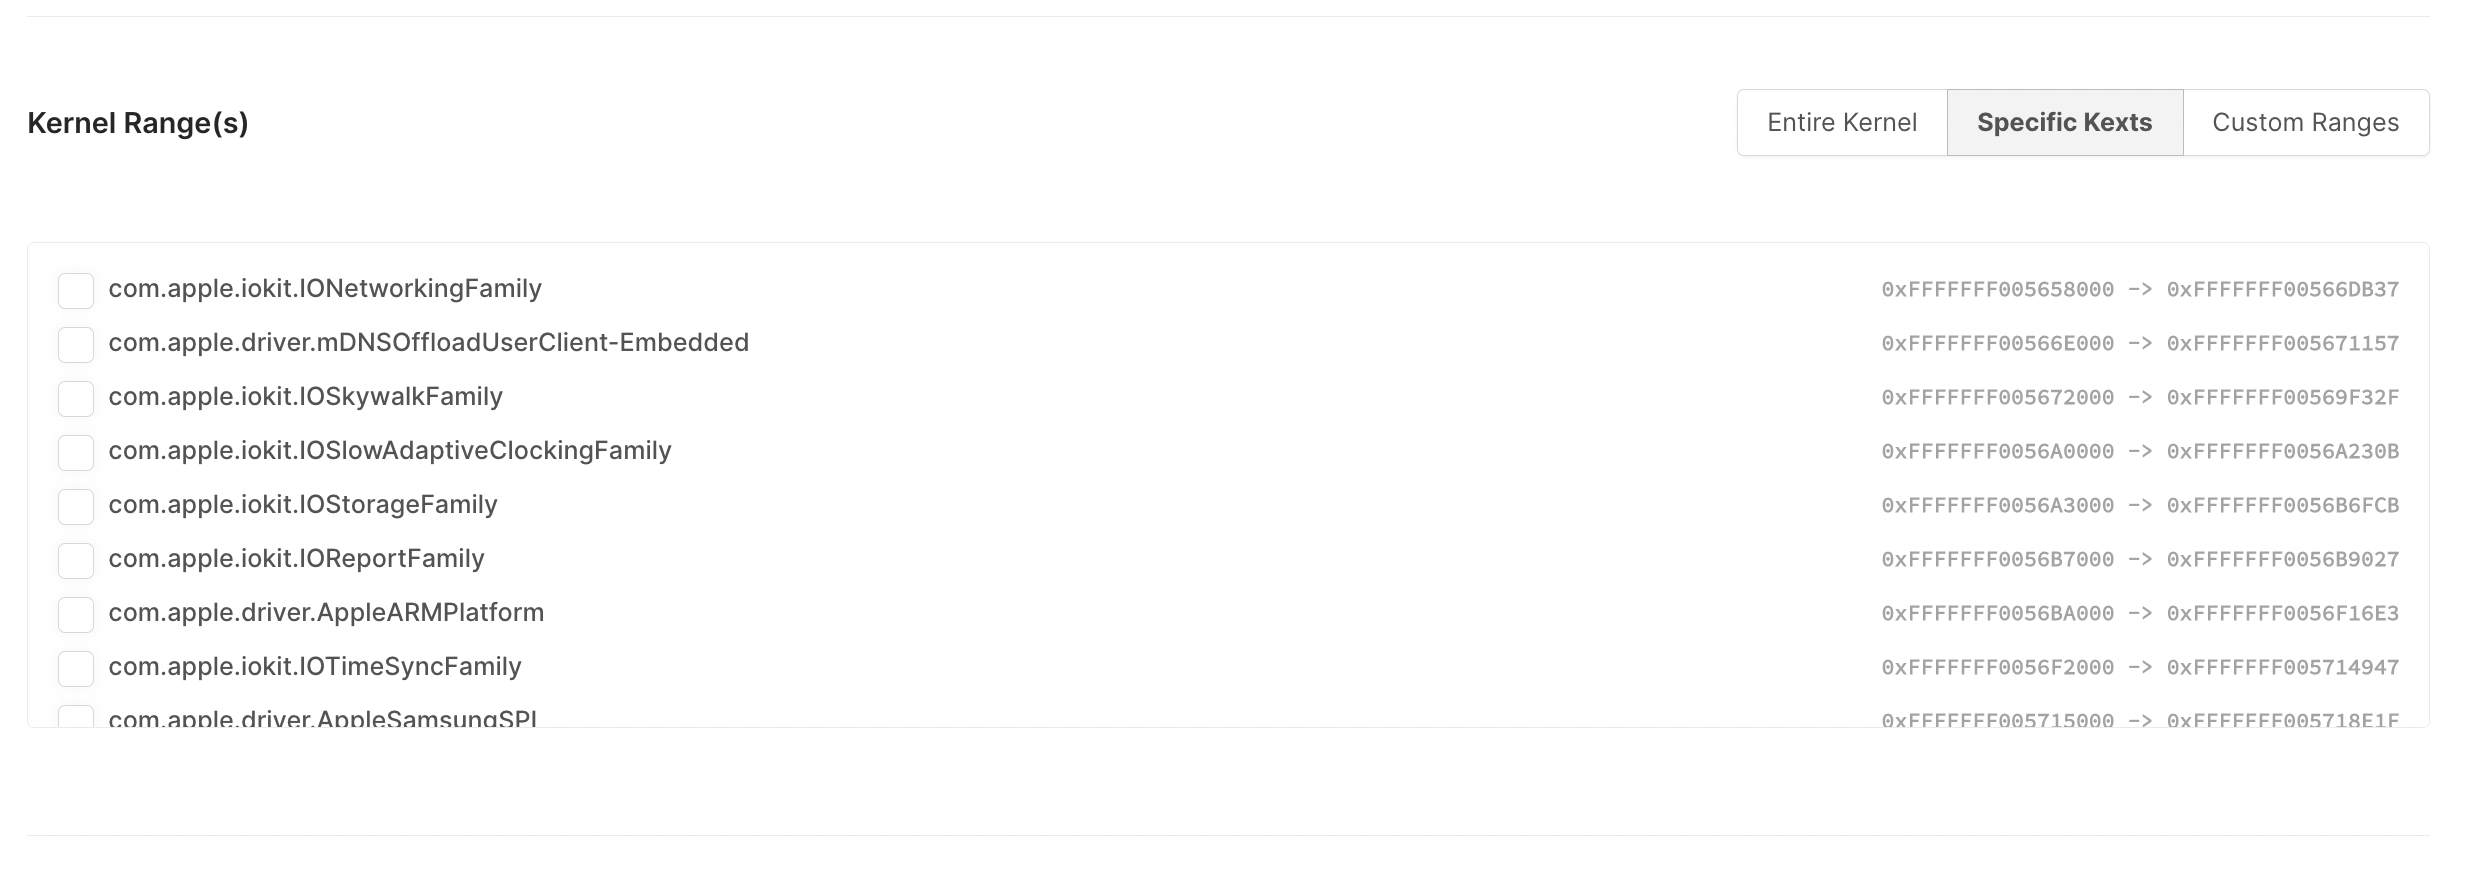
Specific kexts
You can also select specific kexts that you would like to include in tracing logs from kexts list
Custom ranges
You can specify custom ranges by selecting the custom ranges option and specify your ranges.
- custom ranges option selected
- add a new range for tracing
- remove range from tracing
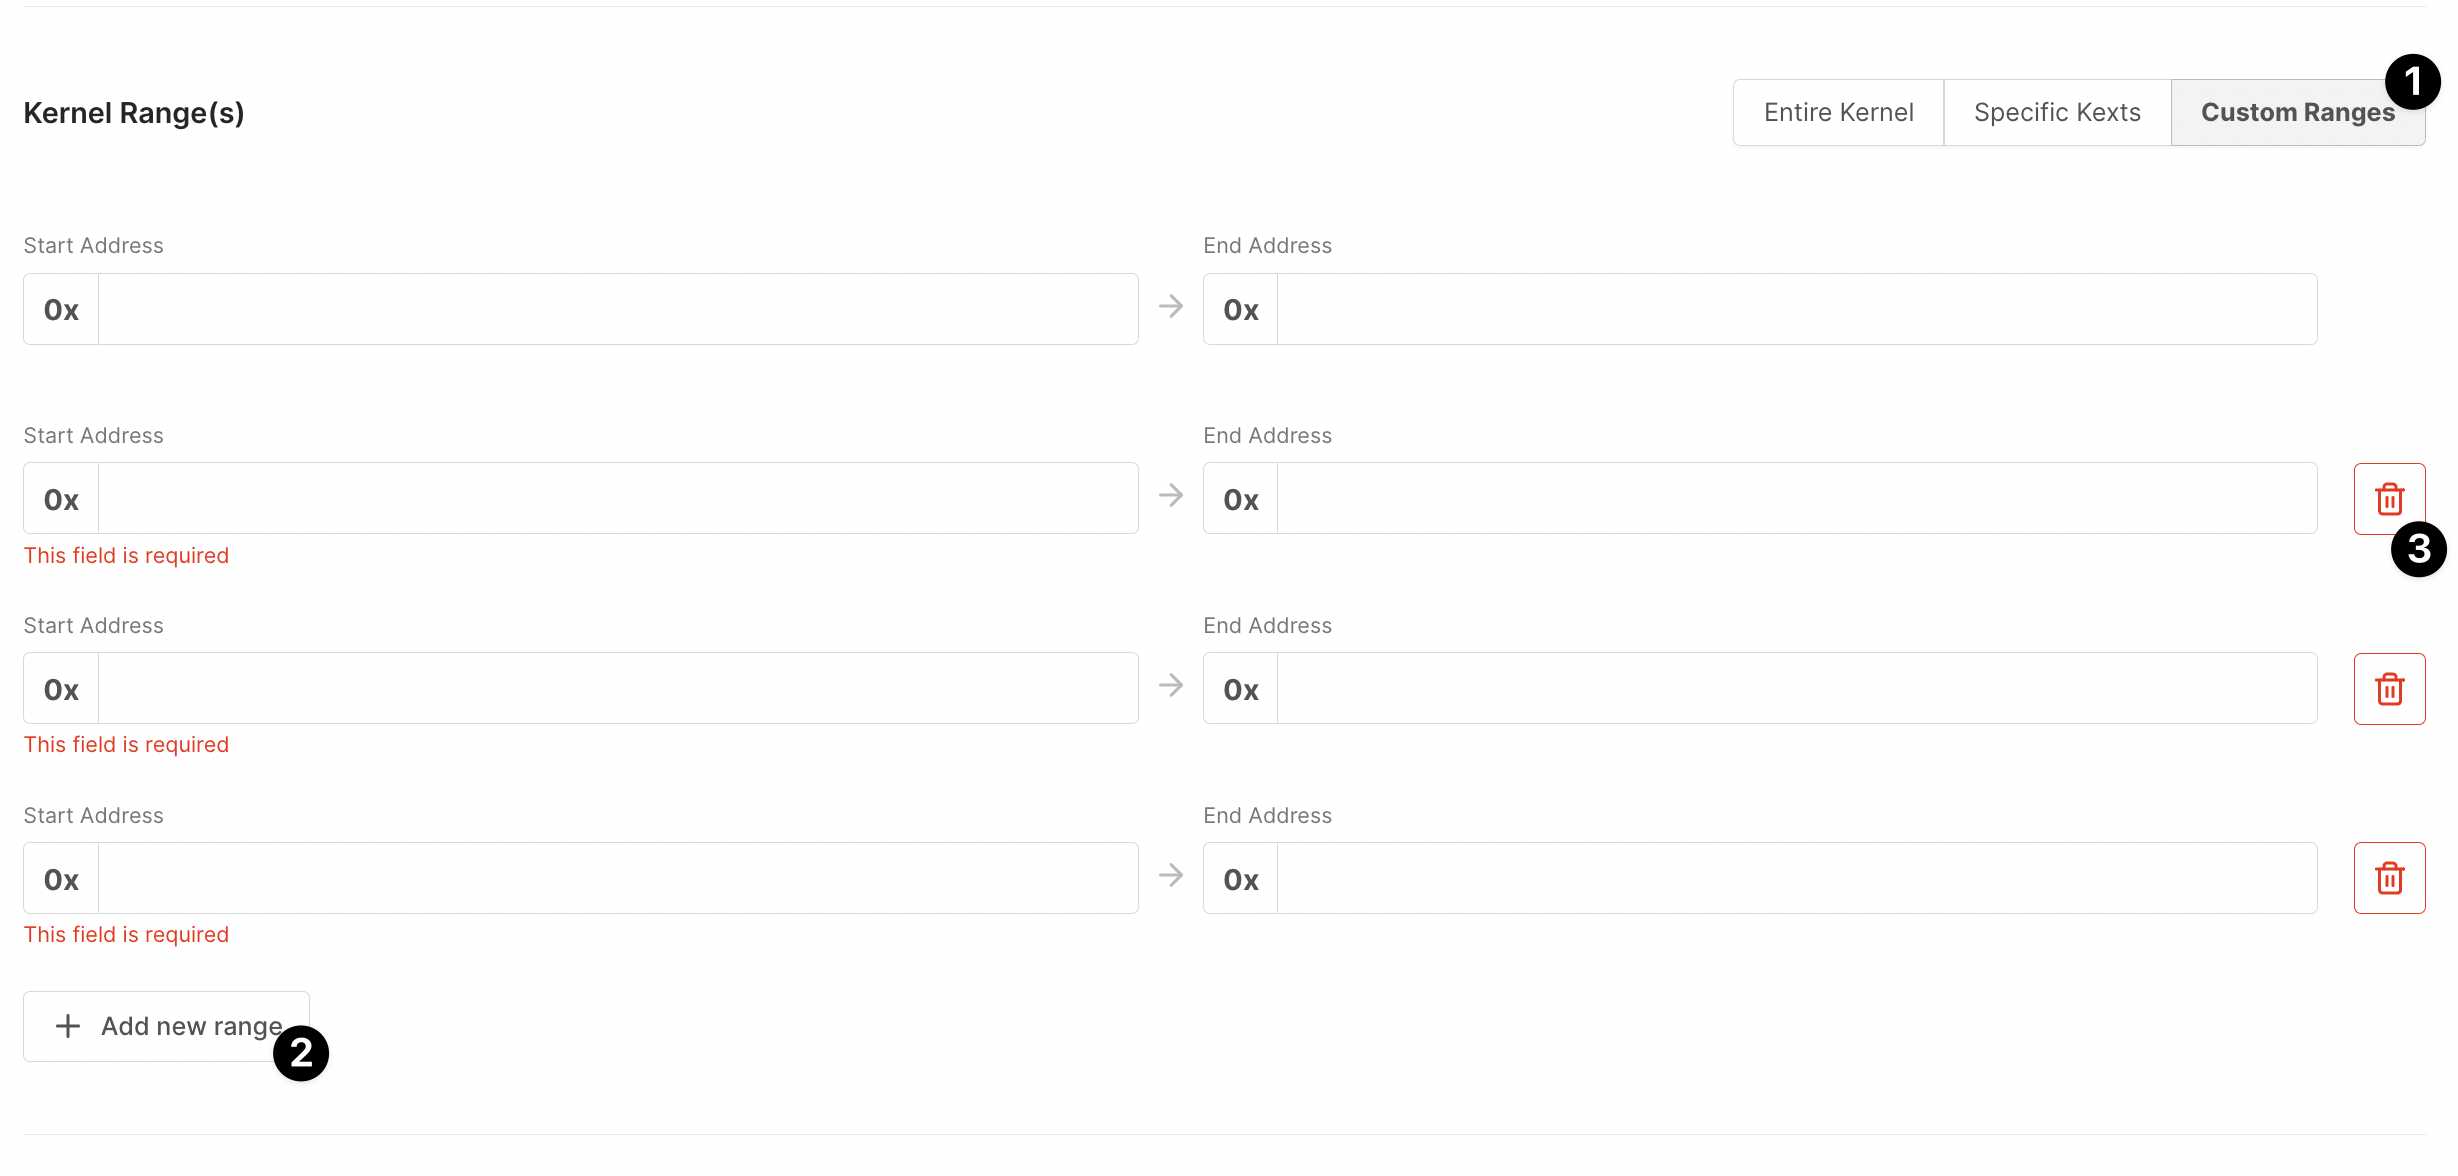
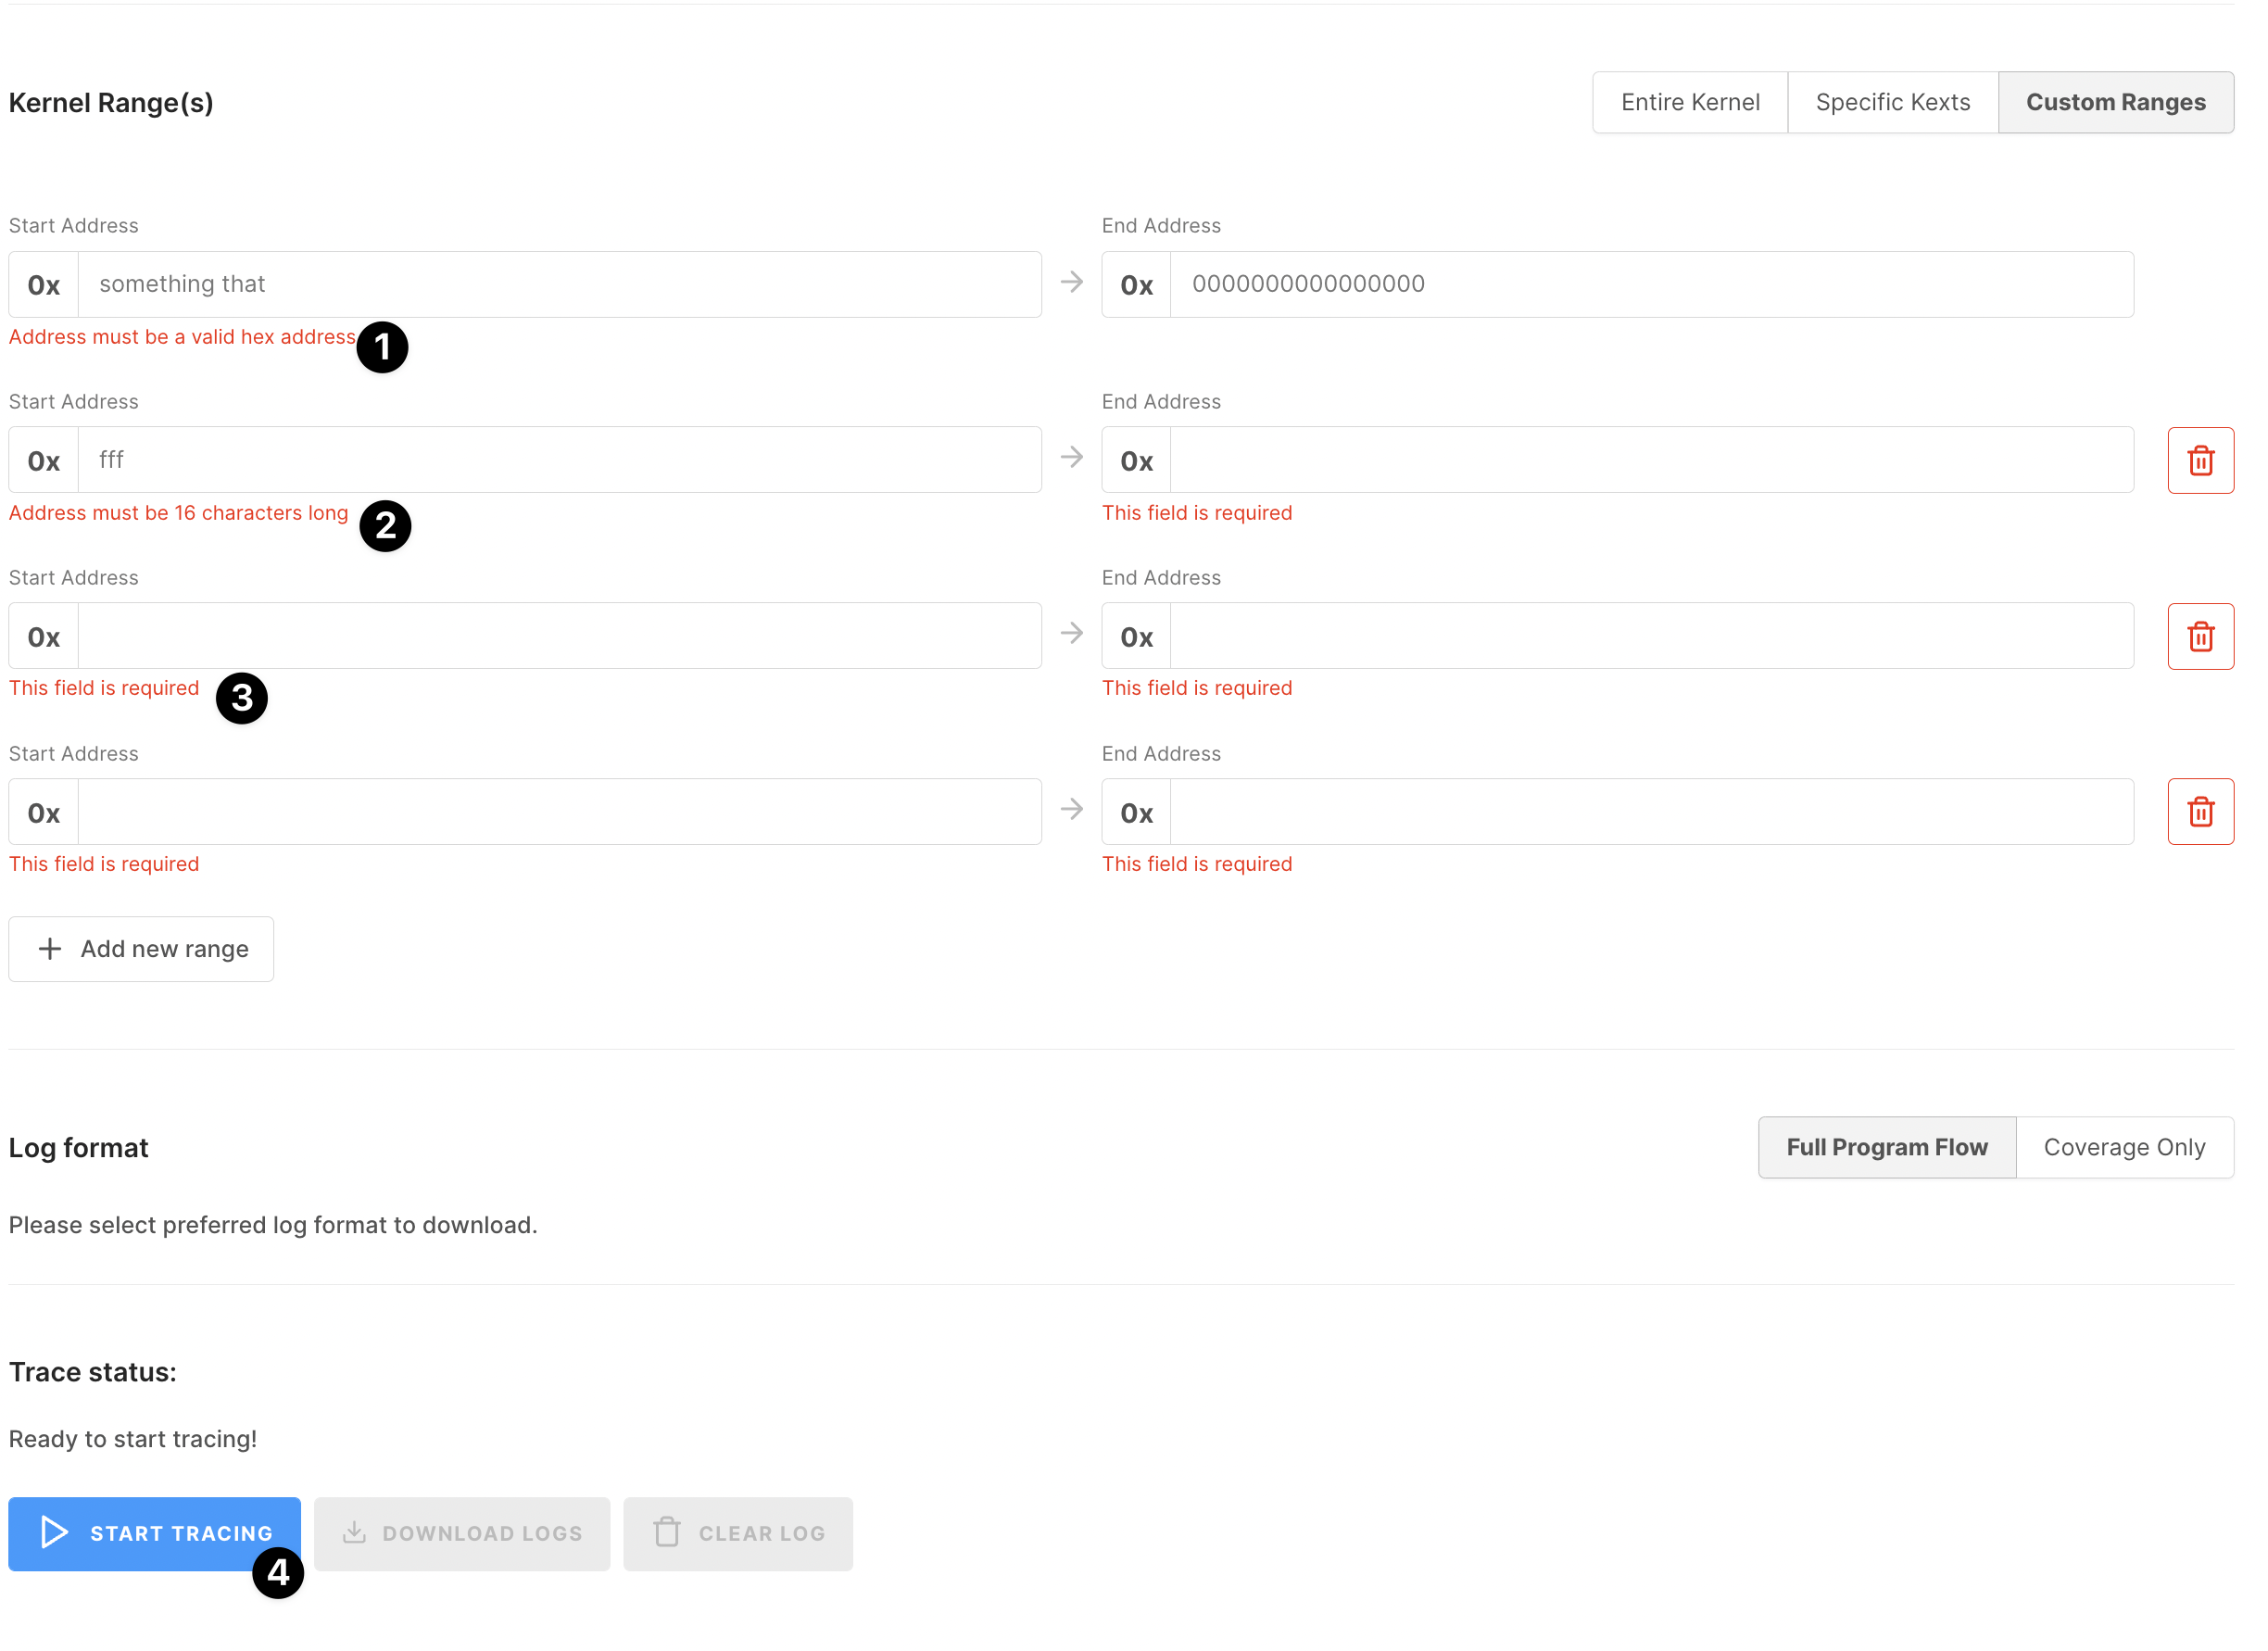
Custom ranges should be a valid hexadecimal number, we validate them against a few rules:
- it must be a valid hex address
- it must be 16 chars long
- when you add a new custom range - start and end addresses are required
- you will see validation errors once you try to start tracing and some of those rules are violated
Tracing progress
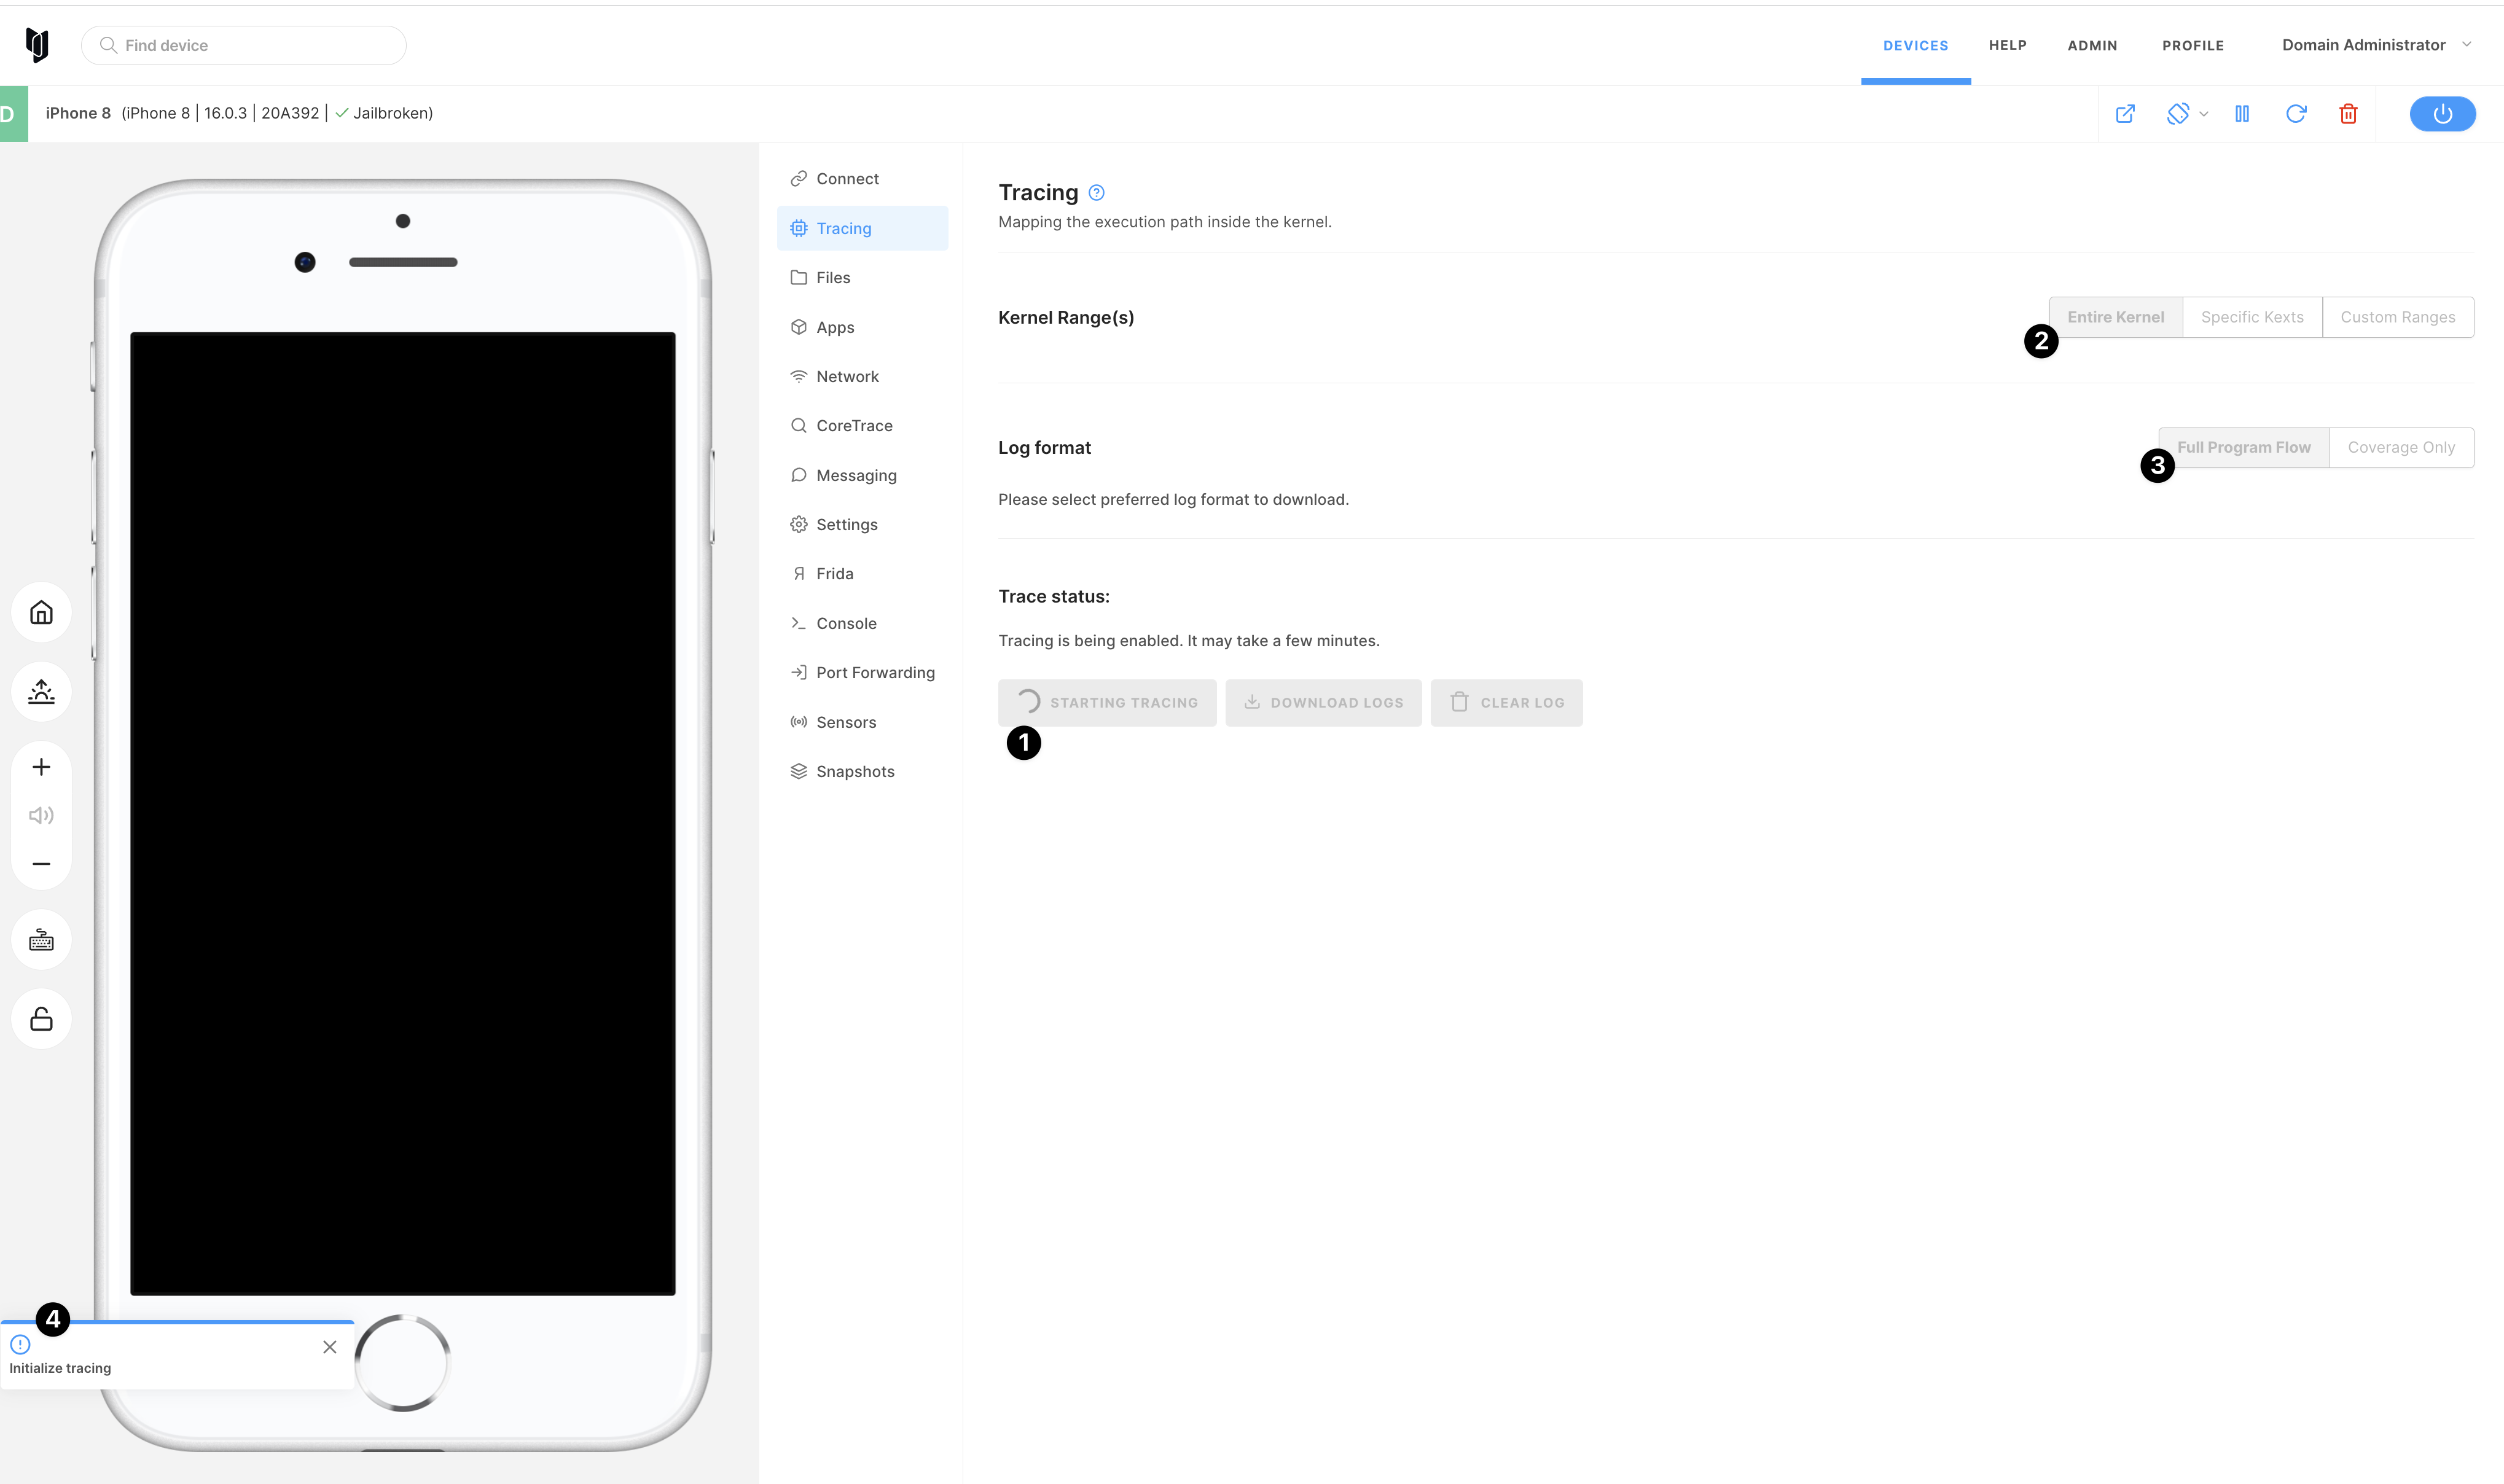
When you initialize tracing by selecting the ranges that you want and clicking the start tracing button we initialize device tracing (1). During tracing initialization and tracing itself ranges options (2) and log format options are disabled (3). Also, you will see a notification that tracing was initialized (4).
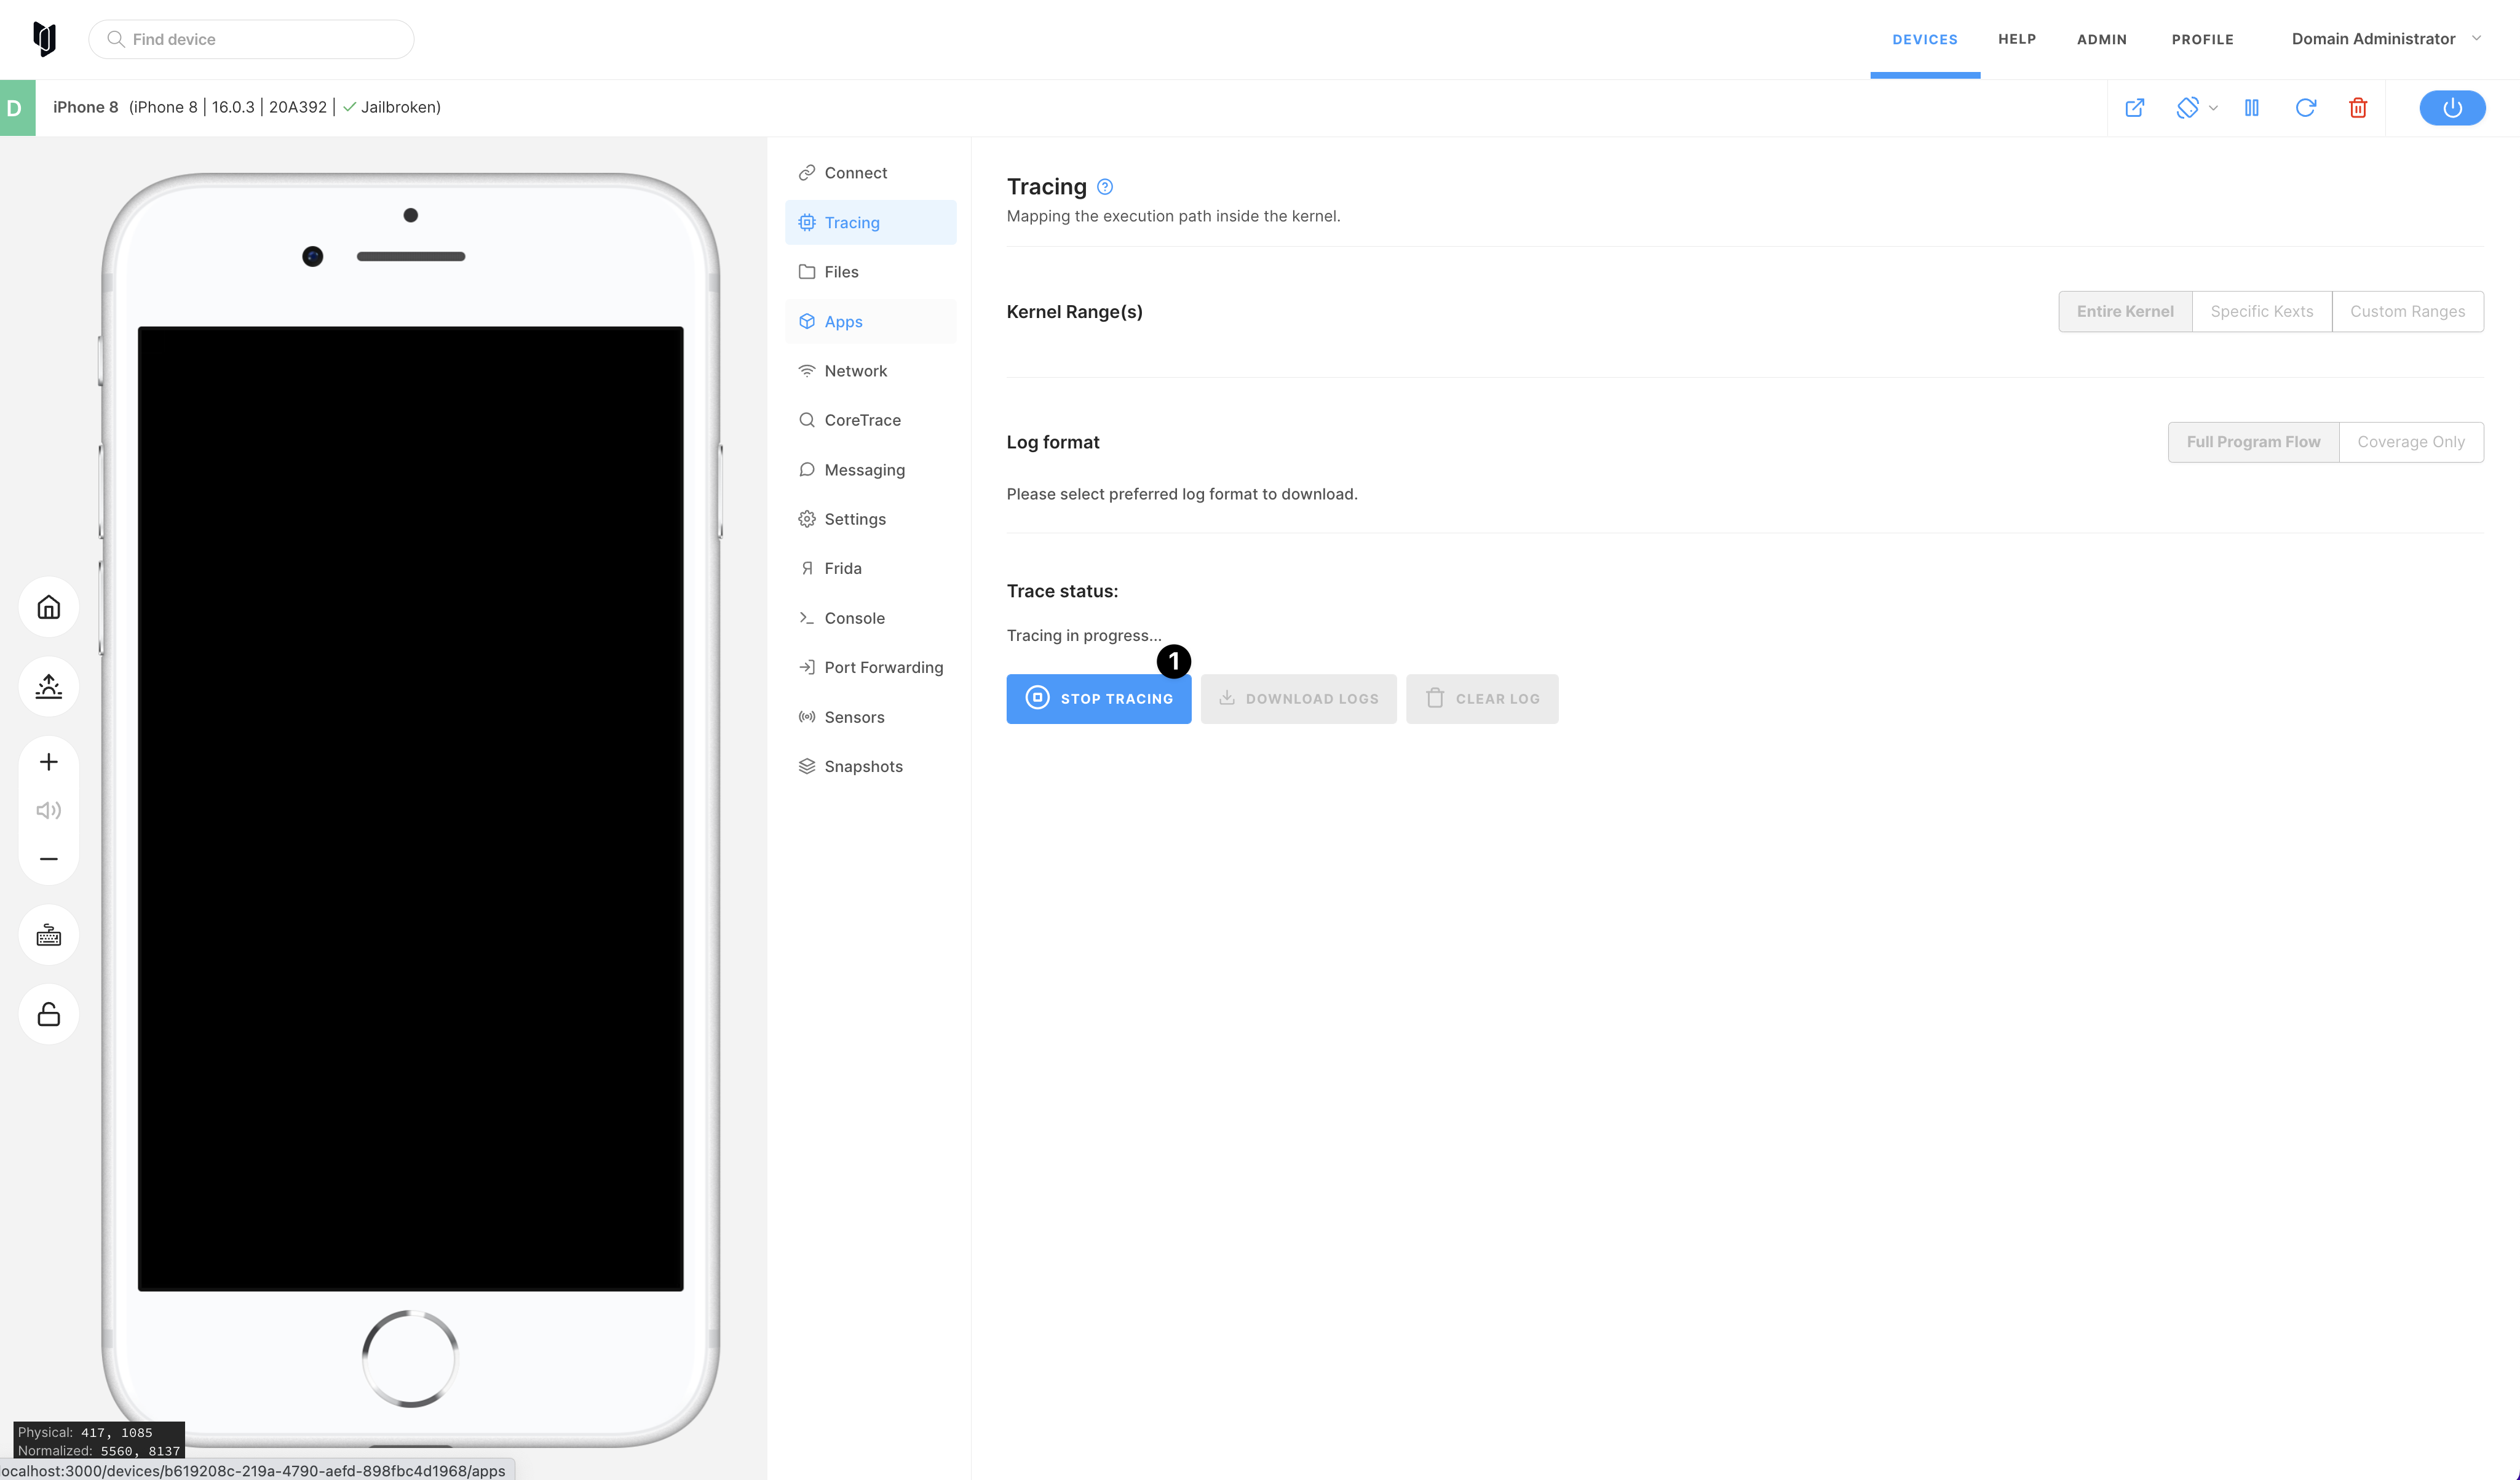
When tracing is started you can see the appropriate status above the start/stop tracing button. You can stop tracing at any time by clicking stop tracing (1)
Tracing is finished
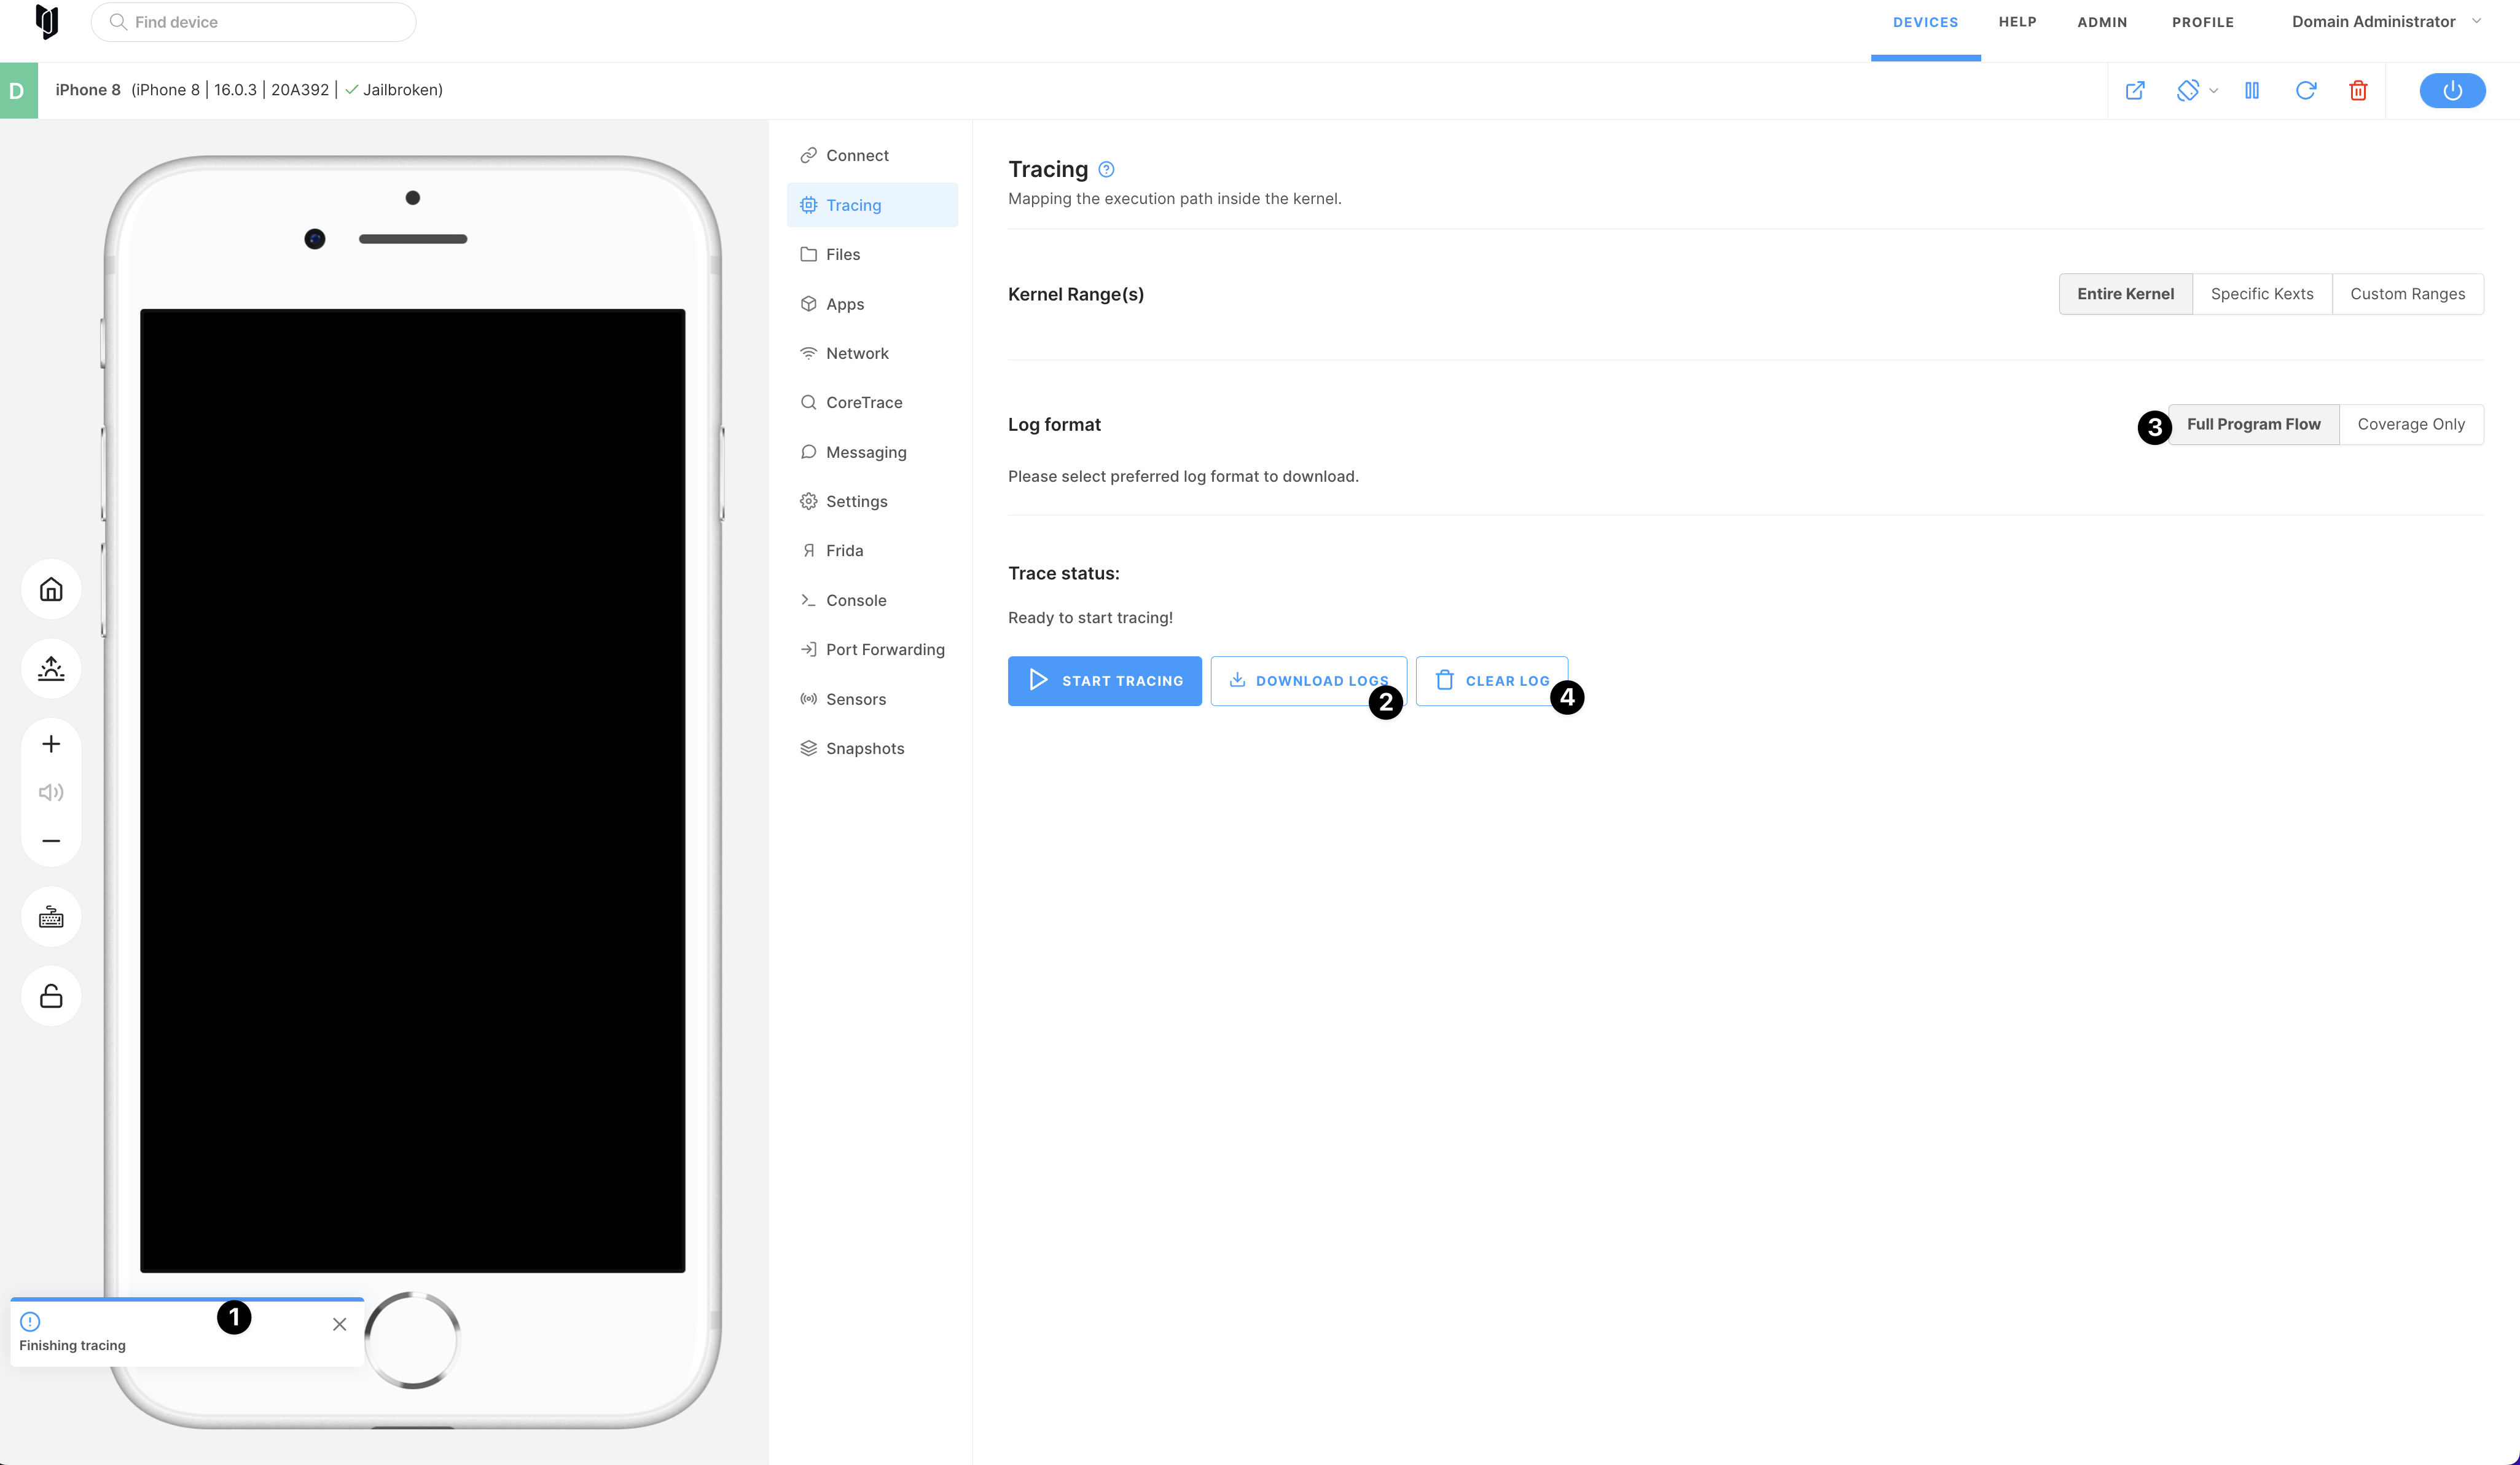
When you stopped tracing by clicking the stop tracing button you will see a notification (1) that we are finishing tracing and preparing logs for download.
After tracing is finished you can select log format (3) and download logs (2). Also, you can clear logs (4) and start tracing again.
The tracing log file will have the following format:
hypertrace-${instanceId}-LogType-${logType}-time-${Date.now()}.log
If you start new tracing without downloading or clearing previous tracing logs - new tracing logs will override the previous one.
Log Formats
Two log formats are supported, detailed below. It is possible to select the desired format at any time, including after tracing is completed.
Full Program Flow
This format contains information about each basic block that was executed. Each line corresponds to a single basic block, starting with a pair of addresses designating the starting and ending address of the block, followed by a description of how the block ended.
Lines starting with # are comments.
0xfffffff0072ce690 0xfffffff0072ce6a3 branch 0xfffffff0072ce638 not taken
0xfffffff0072ce6a4 0xfffffff0072ce6b7 any
0xfffffff0072ce6b8 0xfffffff0072ce6c7 branch 0xfffffff0072ce6b8 not taken
0xfffffff0072ce6c8 0xfffffff0072ce6cb call 0xfffffff0072e0360
0xfffffff0072e0360 0xfffffff0072e0373 branch 0xfffffff0072e0394 not taken
0xfffffff0072e0374 0xfffffff0072e037f branch 0xfffffff0072e038c taken
0xfffffff0072e038c 0xfffffff0072e0393 ret 0xfffffff0072ce6cc
0xfffffff0072ce6cc 0xfffffff0072ce6cf jump 0xfffffff0072ce638
0xfffffff0072ce638 0xfffffff0072ce63f call 0xfffffff0071e37d8
# in sync at 0xfffffff0071e37d8
0xfffffff0071e37d8 0xfffffff0071e37ff jump 0xfffffff0071e3804
| Keyword | Parameters | Description |
|---|---|---|
any | basic block ended in a regular instruction (no control transfer) | |
stx | basic block ended in any of the store-exclusive instructions | |
ldx | basic block ended in any of the load-exclusive instructions | |
jump | <address> | basic block ended in an unconditional jump to the specified address |
jump-ind | <address> | basic block ended in an unconditional indirect jump; actual jump target address printed |
ret | <address> | basic block ended in a function return; actual return address printed |
call | <address> | basic block ended in a function call at the specified address |
call-ind | <address> | basic block ended in an indirect function call; actual function address printed |
branch | <address> <taken> | basic block ended in a conditional branch to the specified address; either taken or not taken printed depending on result |
eret | <address> | basic block ended in an exception return; actual return address printed |
invalid | basic block ended in an invalid opcode, which should not happen in normal operation |
Coverage Only
This format is a subset of Full Program Flow, listing only the addresses of basic blocks that were executed during the tracing period. This is a simple text format with one address per line, suitable for importation into Lighthouse or equivalent coverage visualization tools.
A Note on STX/LDX Instructions
Performing dynamic instrumentation on ARM/Aarch64 has some issues when load-exclusive/store-exclusive instructions are involved. Consequently, the tracing functionality contains automatic special handling for these instructions that prevents installing a tracepoint between an LDX instruction and its corresponding STX instruction. As these are used as a primitive on which locks are built, they are used frequently throughout the iOS kernel. The impact is that the instructions within the STX and corresponding LDX cannot be traced.