RAM Dump
The RAM Dump feature enables one-click capture of a virtual device’s live memory directly from the web UI. It creates a point-in-time memory dump that preserves critical volatile data, including running processes, encryption keys, active network connections, and in-memory artifacts. The tool automates the entire capture process, provides progress updates, and delivers a downloadable memory dump file ready for analysis, eliminating the need for manual or command-line steps.
Using RAM Dump from the Corellium UI
Click on the RAM Dump tab
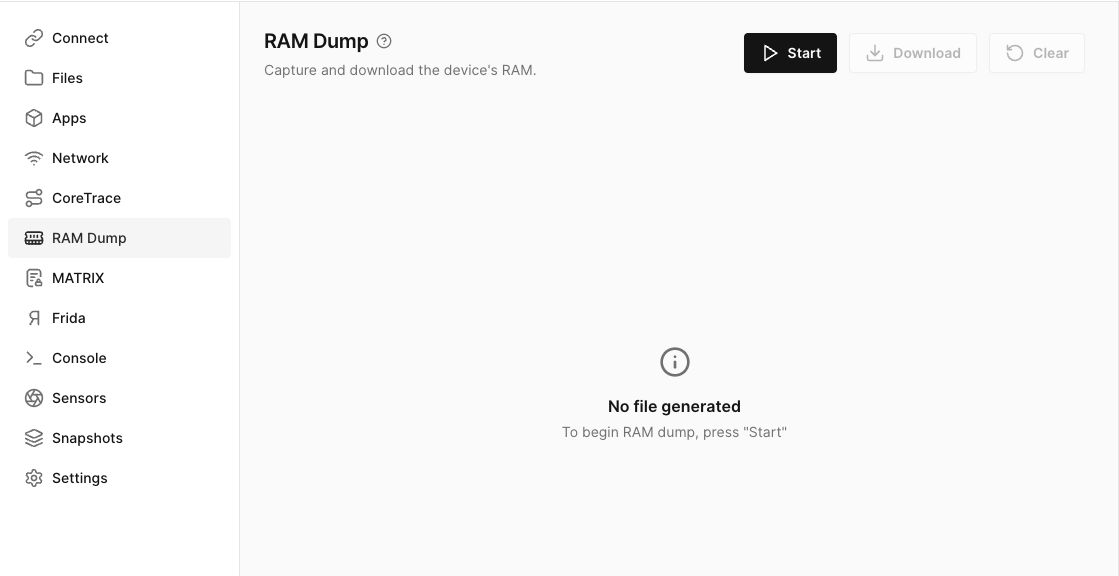
To capture the device's RAM click on the start button. The device will enter into a paused state until the RAM Dump is completed. Once the Dump has completed you will see a message in the UI showing the completion and log size. The device will leave the paused state and you can resume testing.
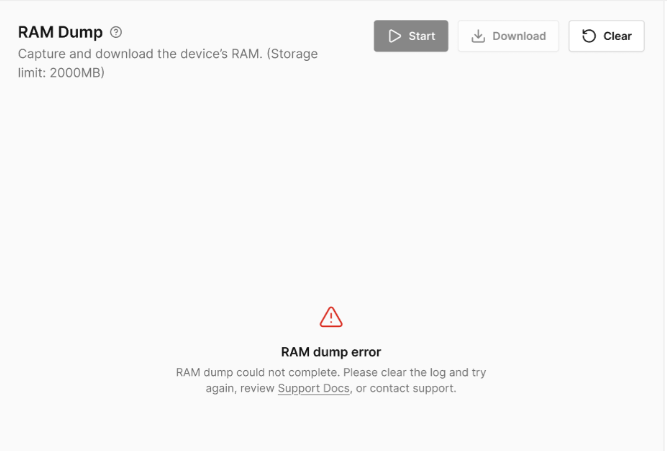
Unsuccessful RAM Dump
If you receive this errormessage during the RAM Dump, you may need to clear out the tmpfsfile. If that is not successful please email us at [email protected] or click on the Chat with a human under your profile tab at the top right hand corner of your screen.
Downloading the RAM Dump from the Corellium UI
Once the RAM Dump has completed you can now click on the Download button. The download will be in a compressed gzip file. The downloaded file will contain the Device Name in the description for easy identification of what device this RAM Dump is associated. You will need to unzip the file and once the file is uncompressed it will be in a .bin format.
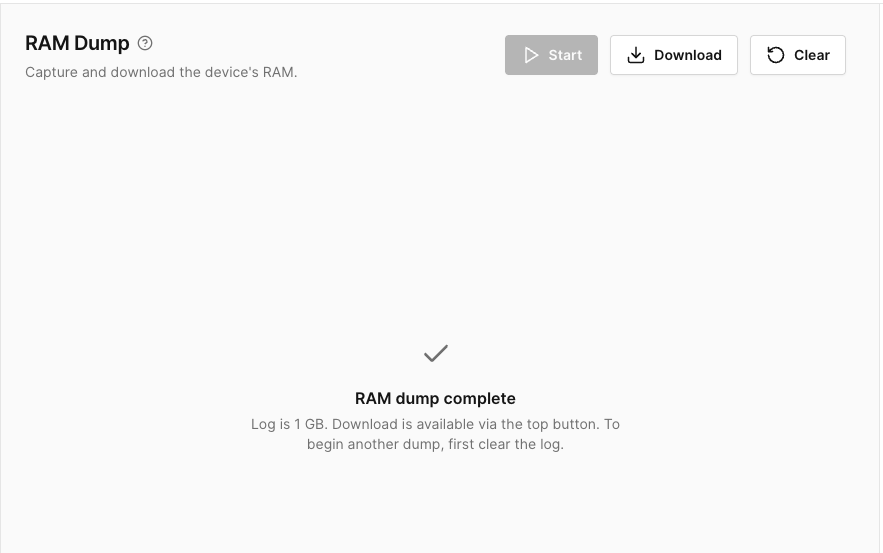
Once you have competed the download and ready to resume testing, please remember to Clear the log before continuing.