Reporting
Once the test has been run, the results are used to generate a report. The report contains metadata about the device and app, an overview of the results, and a thorough breakdown of each check and artifact that was run.
Report Structure
The report contains results across several check categories, such as Authentication, Cryptography, Storage, etc. Each category has several groups of checks, which address a specific security issue such as insecure data storage or insecure network communication. Each group then has a series of checks which are designed to identify specific instances of that security issue.
Each check has a Description, Status (pass, fail, error), Severity (info, low, medium, or high), Impact, Remediation, and Compliance section.
Check Status
Each check reports a status, which can be either:
Pass: The check passed, meaning no security issue was identified.Fail: The check failed, meaning a security issue was identified.Error: The check could not be run, meaning the check itself was inconclusive.N/A: Not applicable to your environment or application.
Check Severity
Each check has a default severity, which can be either:
High: High risk and significant business impact.Medium: Moderate risk and impact, or a combination of low/high risk and impact.Low: This is a common vulnerability with minimal risk and impact.Informational: Highlights helpful system configuration insights and best practice suggestions, not urgent security threats.
Artifact Status
We also produce artifacts, which are the contents of a file detected during the MATRIX scan. These files are typically found in the application's binary and can be used to identify potential security vulnerabilities. You can learn more about artifacts in our Artifacts documentation.
Artifacts have three potential statuses:
Error: The artifact could not be found, meaning the results were inconclusive.Artifact: The artifact was found and identified.N/A: Not applicable to your environment or application.
When an artifact is detected and a vulnerability is identified, we return a payload of the data such as the insecure data storage location or the insecure network communication endpoint. This payload can be used to identify the exact location of the security issue in the app.
MATRIX Score
Risk‑Based Scoring – The MATRIX Score is a real‑time, computed “risk score” that calculates based on the number of vulnerabilities and their severity levels identified during a mobile application security test.
Dynamic Updating – As your AppSec team nullifies findings or adjusts severities, the score is refreshed automatically to reflect the current risk posture.
You may need to refresh the page for the MATRIX score to update after reverting all changes in a test.
Audit‑Ready Log – Every modification (nullification, severity change, evidence edit) is recorded in an immutable audit trail, ensuring full traceability for compliance and governance.
Compliance Reporting
Once your tests are complete, you can see how each compliance field maps to the check in question. Compliance reporting is included for both passed and failed checks, and includes OWASP MASTG, MASWE, CVE, CWE, GDPR, PCI, NIAP and HIPAA.
Suppress Evidence
If needed you can suppress evidence from a failed check. Learn more about how to Suppress Evidence
File Path
In the MATRIX report from the UI, you can investigate the Failed Checks evidence and Artifacts output using icons that appear when you hover on them. Below are descriptions of the icons and their functionality. Learn more about Files.
-
 This allows you to copy the file path.
 -
 This takes you directly to the file.
 -
 This allows you to download the file.
Activity Log
The activity tab displays a log of all changes made to the report. You’ll have the ability to filter by user, events, item, and date ranges. If you are looking for something specific, we also have a search function.
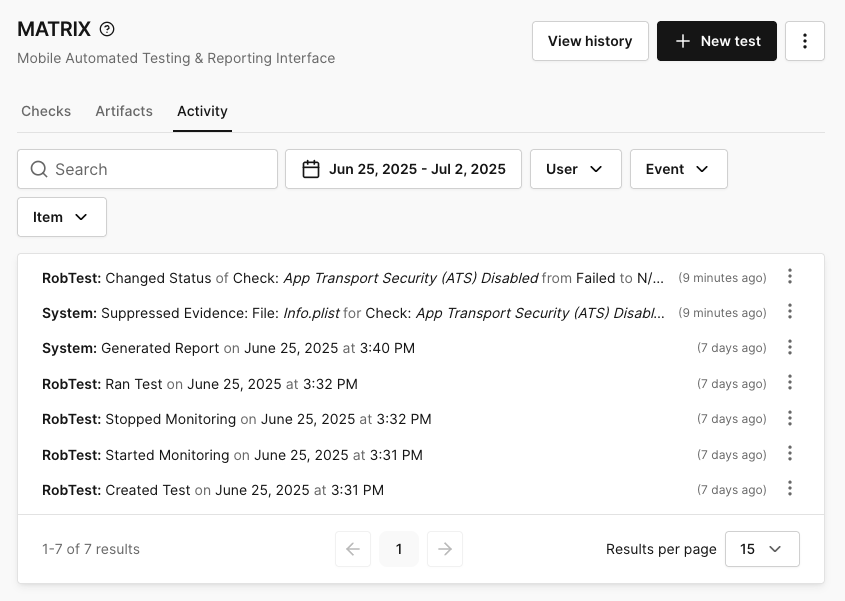
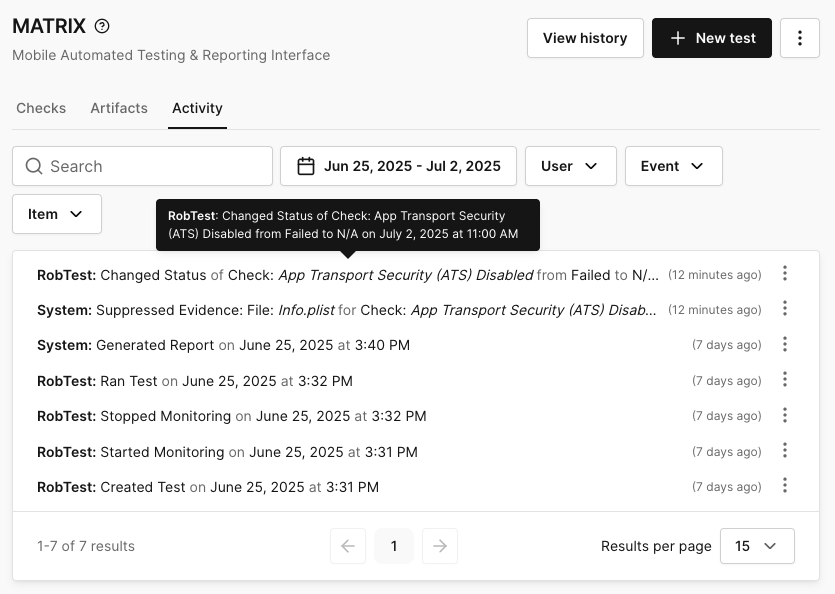
When you're inspecting the log, if a message is truncated, you can view the full message by hovering over it.
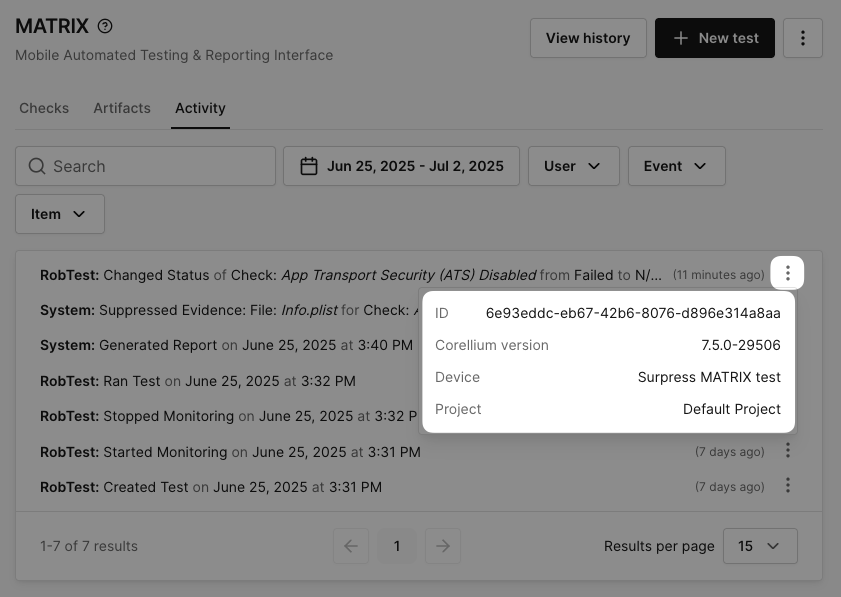
You can also get more information by clicking the ellipsis on the far right of the log to view the ID, version, device, and project.
The Activity Log will also be included at the bottom of the HTML Report.
Downloading the Report
The report is generated as an html and a json file. You can download the report from the Corellium UI or API. If you're running in a CI flow, you can upload the report as an artifact to the CI provider for easy access.
HTML Report
The HTML report is a human-readable version of the report, which can be viewed in a web browser. It contains a summary of the app, device and report, as well as a breakdown of the security issues identified by the checks. View an example HTML report for our Corellium Cafe test app to see what the report looks like.
JSON Report
The JSON report is a machine-readable version of the report, which can be used to parse the report data programmatically. It contains the same information as the HTML report, but in a structured format.